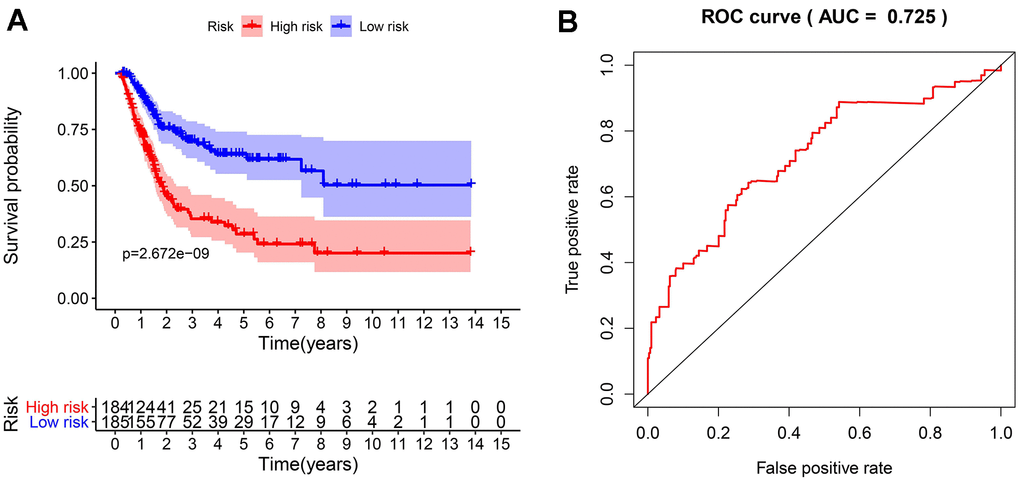
Figure 5.The evaluation of the IRGPI. (A) The Kaplan-Meier curves of OS for patients with high-risk scores (red line) and low-risk scores (blue line); (B) Verification of the accuracy of the IRGPI based on analysis of the AUC of the survival-dependent ROC curve.