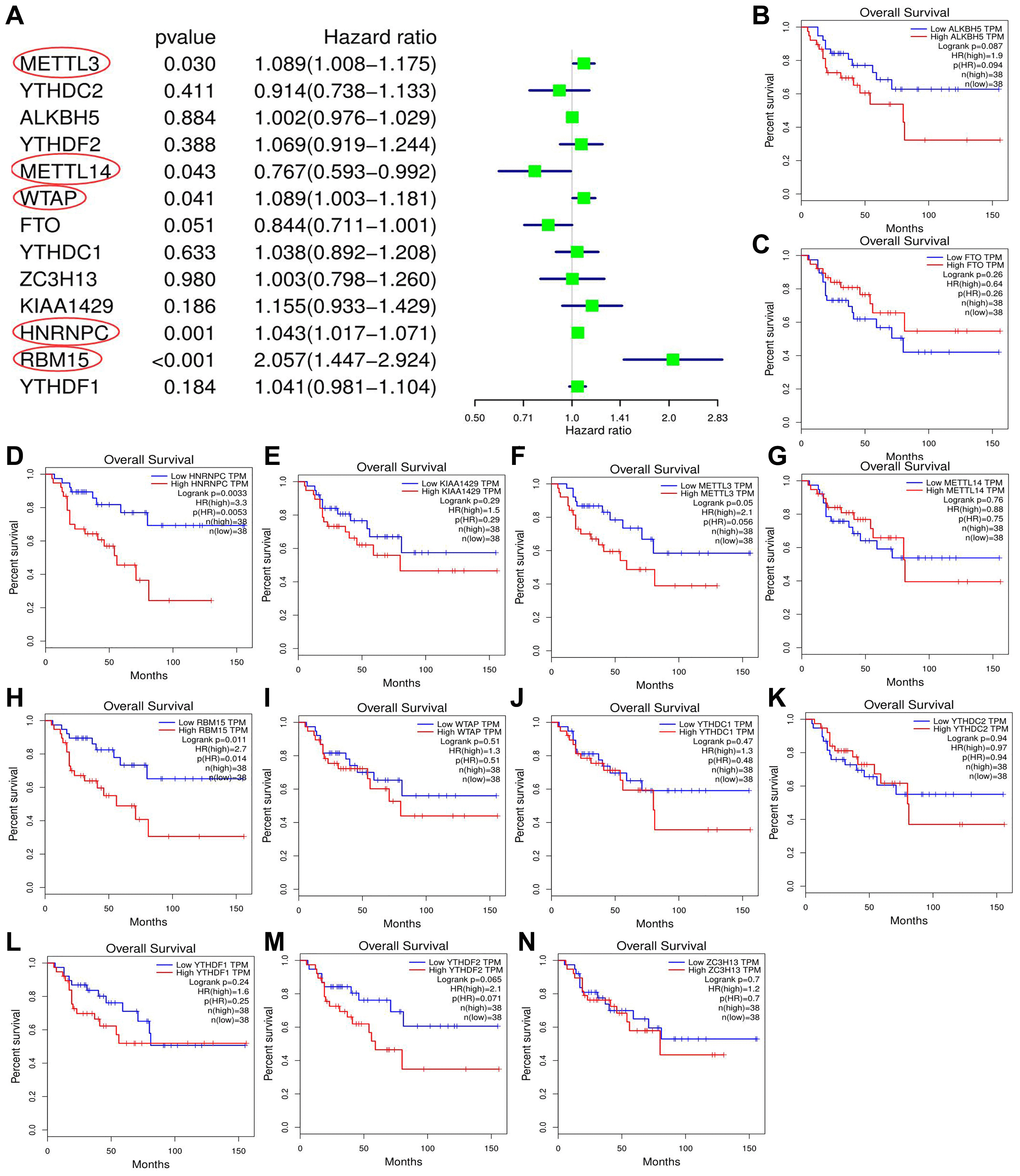
Figure 3.Screening of m6A prognostic genes. (A) Cox univariate prognostic analyses of m6A-related genes based on TCGA database. (B–N) Prognostic difference of m6A-related genes between high- and low-expression groups based on GEPIA database. Group cutoff is set as median of gene expression.