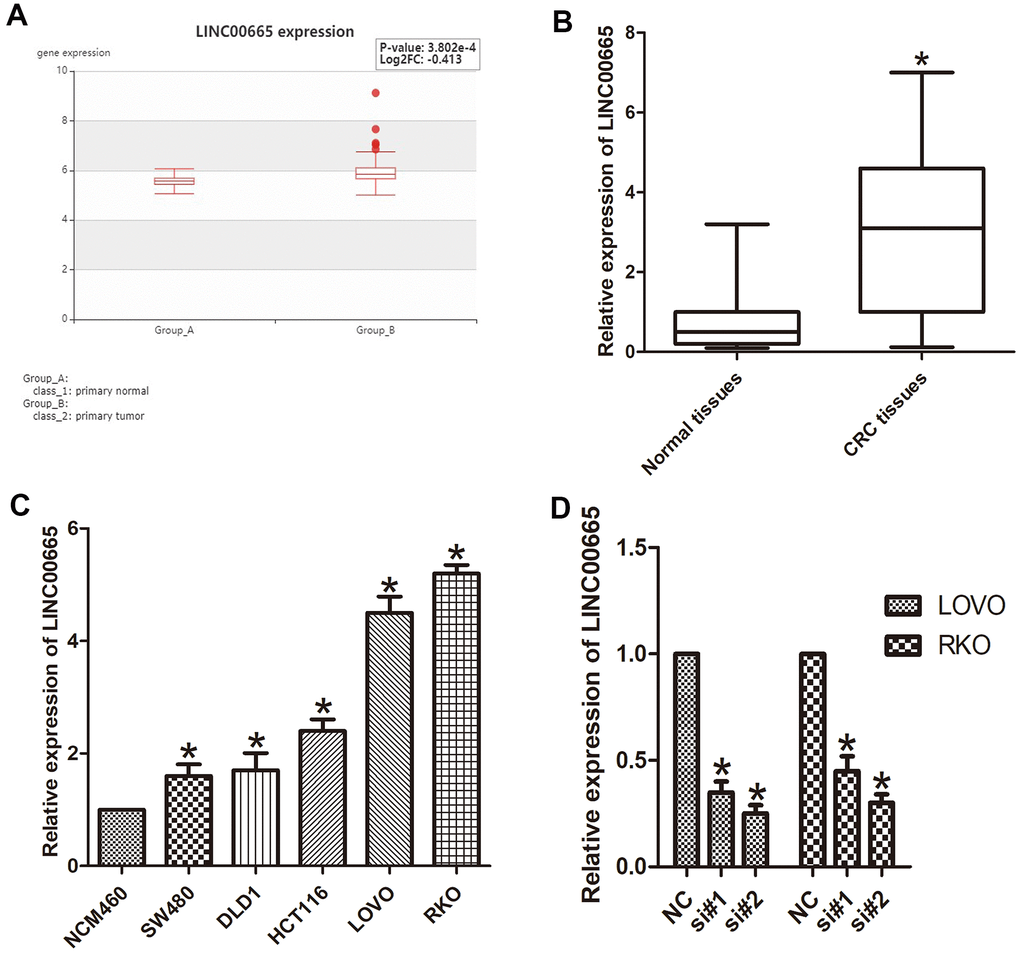
Figure 1.LINC00665 expression was upregulated in CRC tissues and cell lines. (A) LINC00665 was overexpressed in CRC tissues as indicated by HCMDB data analysis (*P < 0.01). (B) qPCR was used to measure the expression level of LINC00665 (*P < 0.01). (C) The expression levels of LINC00665 in multiple CRC cell lines compared with NCM460 normal colonic epithelial cells (n = 6; *P < 0.05 vs NCM460). (D) The knockdown efficiencies were examined in LOVO cells and RKO cells transfected with si-LINC00665 (si#1 and si#2; n = 6; *P < 0.05 vs NC).