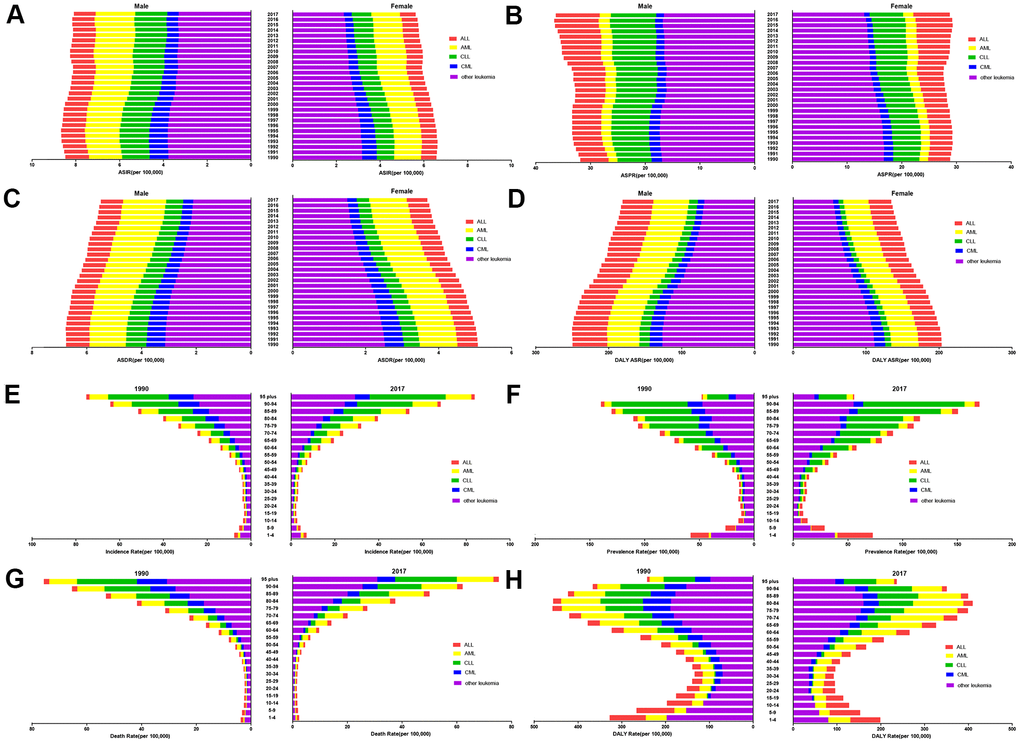
Figure 4.The distribution of leukemia (A) ASIRs, (B) ASPRs, (C) ASDRs, and (D) age-standardized DALY rates from 1990 to 2017 by sex. The proportions of the five subtypes leukemia in the different age groups in 1990 and 2017, and the burdens associated with the (E) ASIR, (F) ASPR, (G) ASDR, and (H) age-standardized DALY rate.