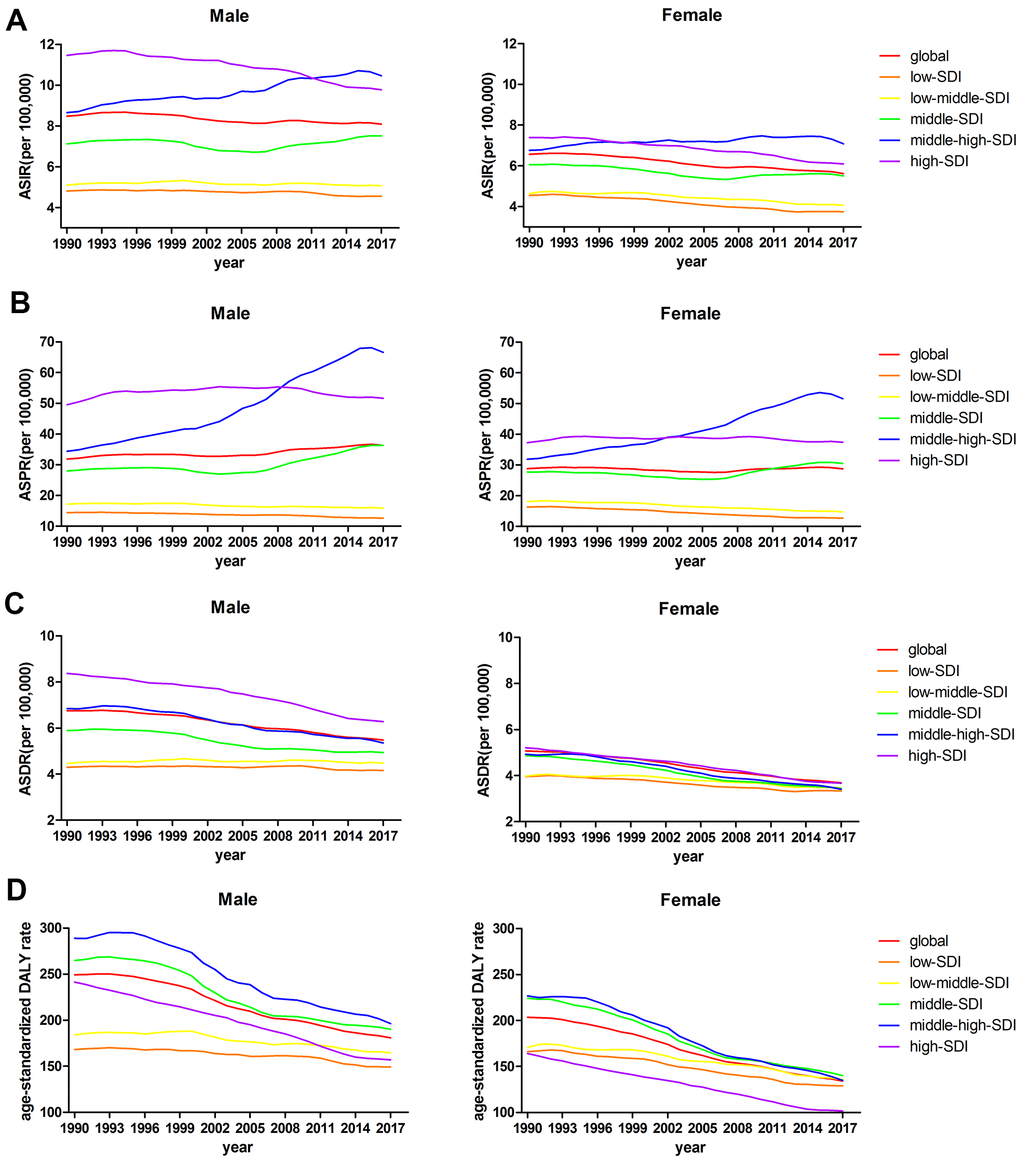
Figure 3.(A) ASIRs, (B) ASPRs, (C) ASDRs, and (D) age-standardized DALY rates from 1990 to 2017 by sex.
Figure 3 — Global, regional, and national burdens of leukemia from 1990 to 2017: a systematic analysis of the global burden of disease 2017 study | Aging