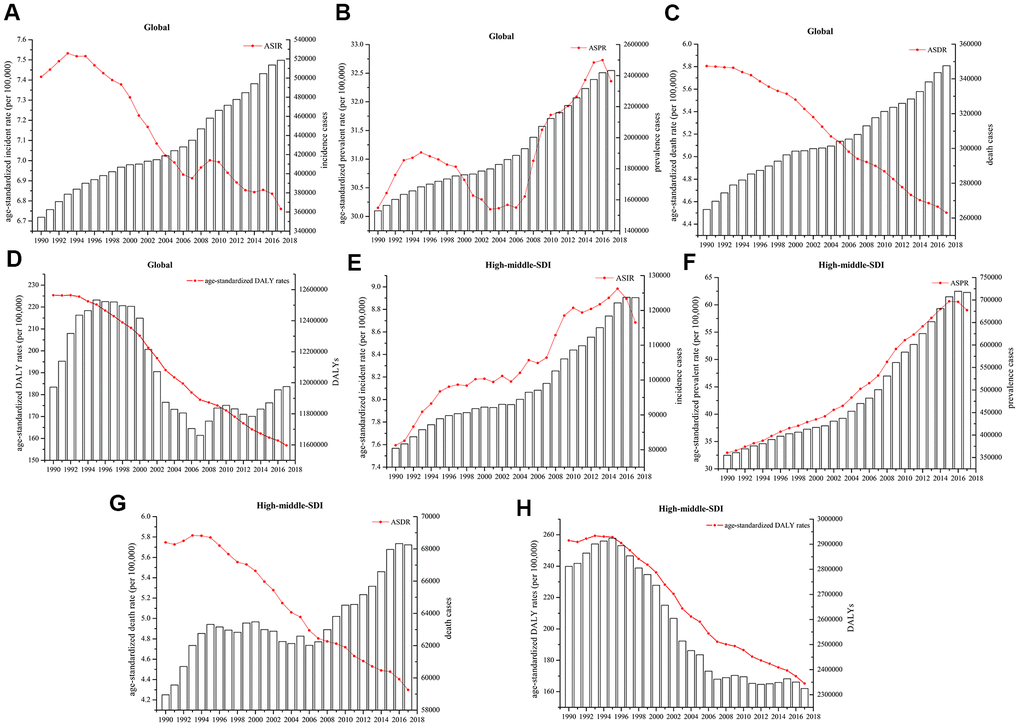
Figure 1.Numbers of cases and age-standardized (A, E) incidence, (B, F) prevalence, (C, G) death, and (D, H) DALY rates globally and in high-middle-SDI countries and territories.
Figure 1 — Global, regional, and national burdens of leukemia from 1990 to 2017: a systematic analysis of the global burden of disease 2017 study | Aging