Submit an Article
Navigate
Home
Editorial Board
Editorial Policies
Current Volume
Archive
Scientific Integrity
Publication Ethics Statements
Interviews with Outstanding Authors
Newsroom
Sponsored Conferences
Podcast
Contact
Special Collections
Submit an Article
Online ISSN: 1945-4589
Research Paper
|
Volume 13, Issue 7
|
pp. 10396–10414
The construction and analysis of a ferroptosis-related gene prognostic signature for pancreatic cancer
Back to article
Figure 3
(3 of 8)
−
100%
+
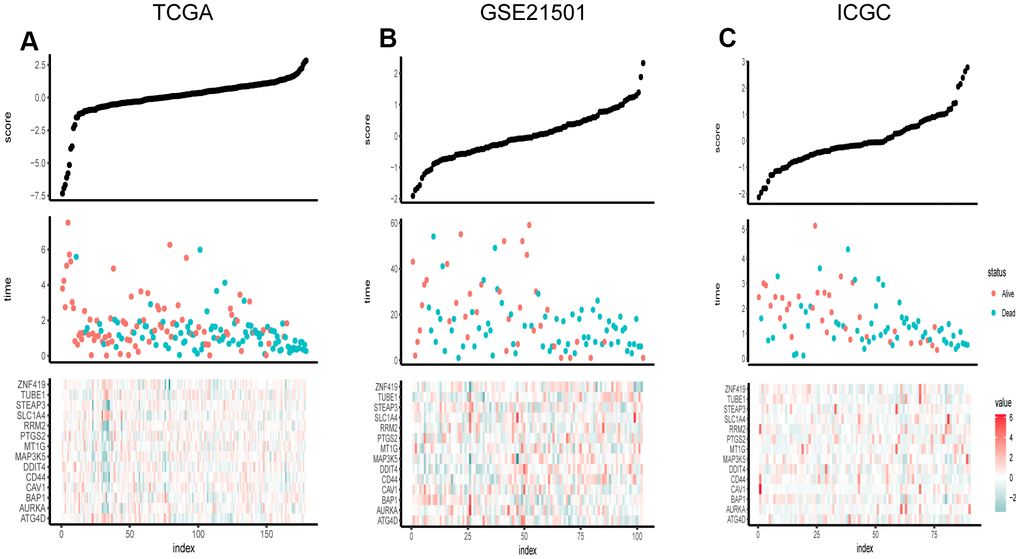
Figure 3.
Risk score distribution, survival overview and heatmap of key genes in the TCGA (
A
), GSE21501 (
B
), and ICGC (
C
). The heatmaps were applied to visualize the expression levels of key genes in every sample.