Submit an Article
Navigate
Home
Editorial Board
Editorial Policies
Current Volume
Archive
Scientific Integrity
Publication Ethics Statements
Interviews with Outstanding Authors
Newsroom
Sponsored Conferences
Podcast
Contact
Special Collections
Submit an Article
Online ISSN: 1945-4589
Research Paper
|
Volume 13, Issue 7
|
pp. 10289–10311
A novel immune-related prognostic signature in epithelial ovarian carcinoma
Back to article
Figure 3
(3 of 7)
−
100%
+
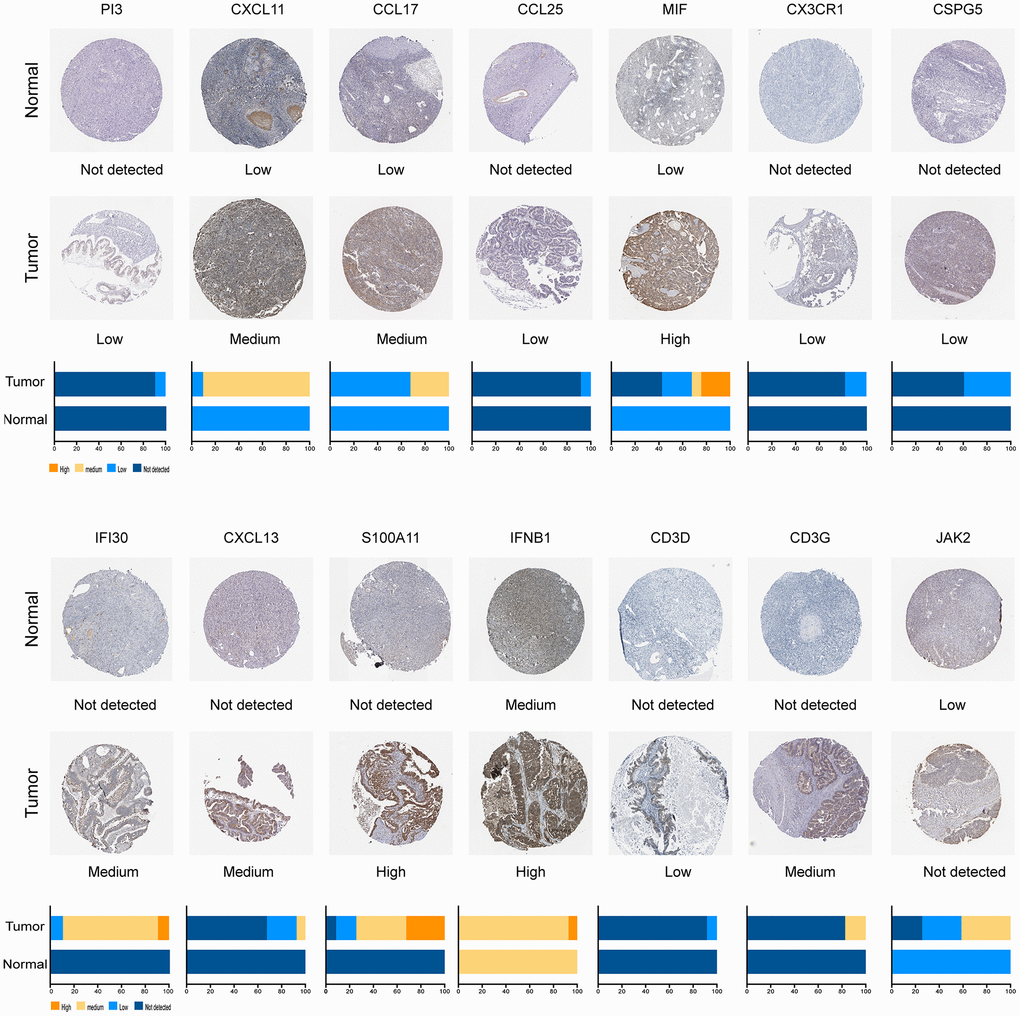
Figure 3.
Differential expression of prognostic IRGs in EOC in normal and EOC tissues.