Submit an Article
Navigate
Home
Editorial Board
Editorial Policies
Current Volume
Archive
Scientific Integrity
Publication Ethics Statements
Interviews with Outstanding Authors
Newsroom
Sponsored Conferences
Podcast
Contact
Special Collections
Submit an Article
Online ISSN: 1945-4589
Research Paper
|
Volume 13, Issue 7
|
pp. 10187–10207
circRNA expression profiling of colon tissue from mesalazine-treated mouse of inflammatory bowel disease reveals an important circRNA-miRNA-mRNA pathway
Back to article
Figure 4
(4 of 8)
−
100%
+
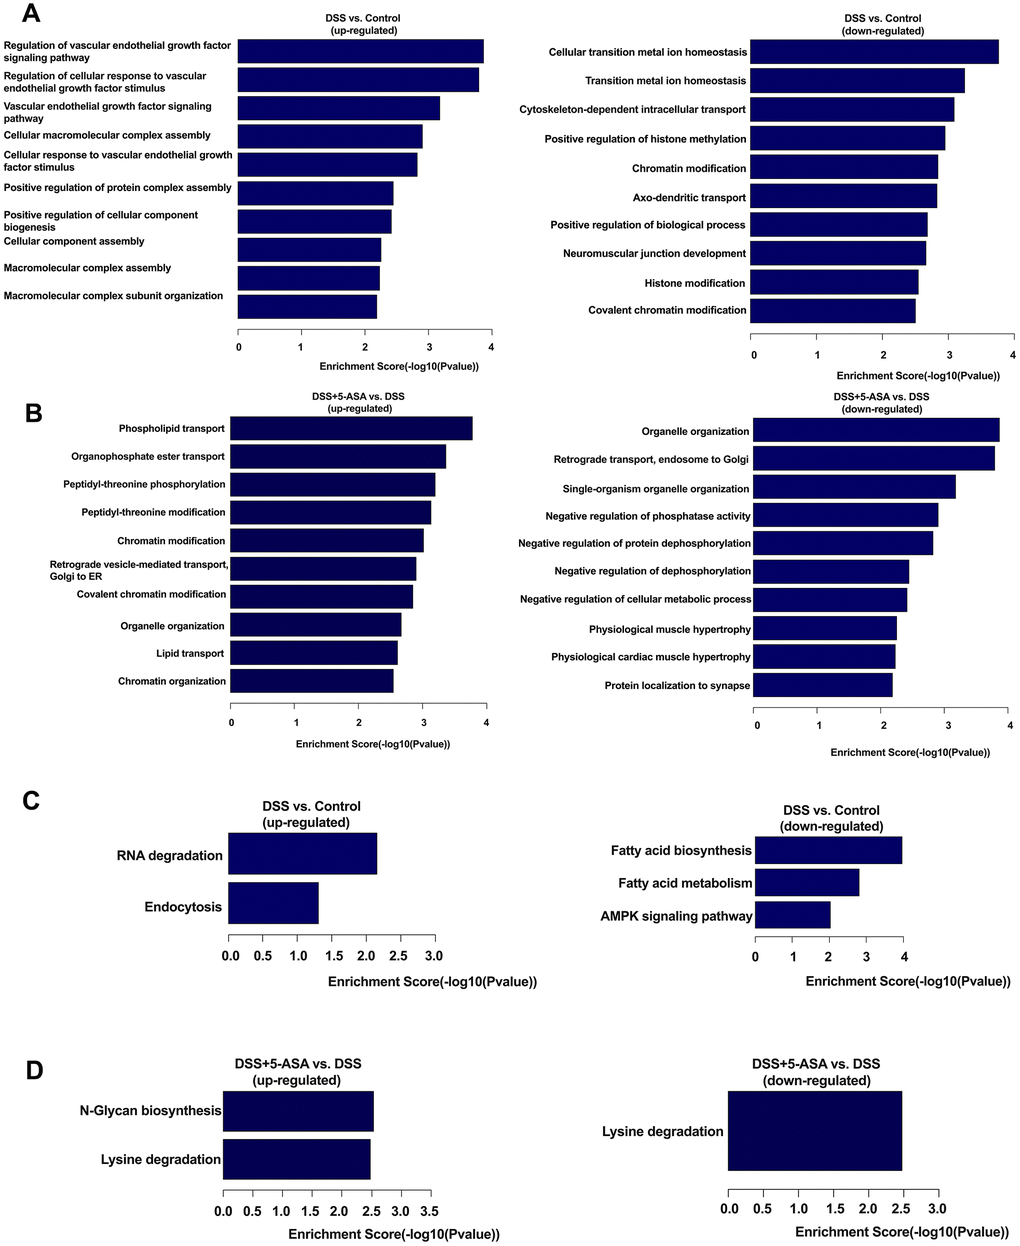
Figure 4.
GO and KEGG pathway analysis of differentially expressed circRNA-associated genes.
Top ten enriched BP terms in DSS vs. control (
A
) and DSS+5-ASA vs. DSS (
B
) group. All pathways in DSS vs. Control (
C
) and DSS+5-ASA vs. DSS (
D
) group.