Submit an Article
Navigate
Home
Editorial Board
Editorial Policies
Current Volume
Archive
Scientific Integrity
Publication Ethics Statements
Interviews with Outstanding Authors
Newsroom
Sponsored Conferences
Podcast
Contact
Special Collections
Submit an Article
Online ISSN: 1945-4589
Research Paper
|
Volume 13, Issue 7
|
pp. 9991–10014
Transcriptome and lipidome profile of human mesenchymal stem cells with reduced senescence and increased trilineage differentiation ability upon drug treatment
Back to article
Figure 5
(5 of 7)
−
100%
+
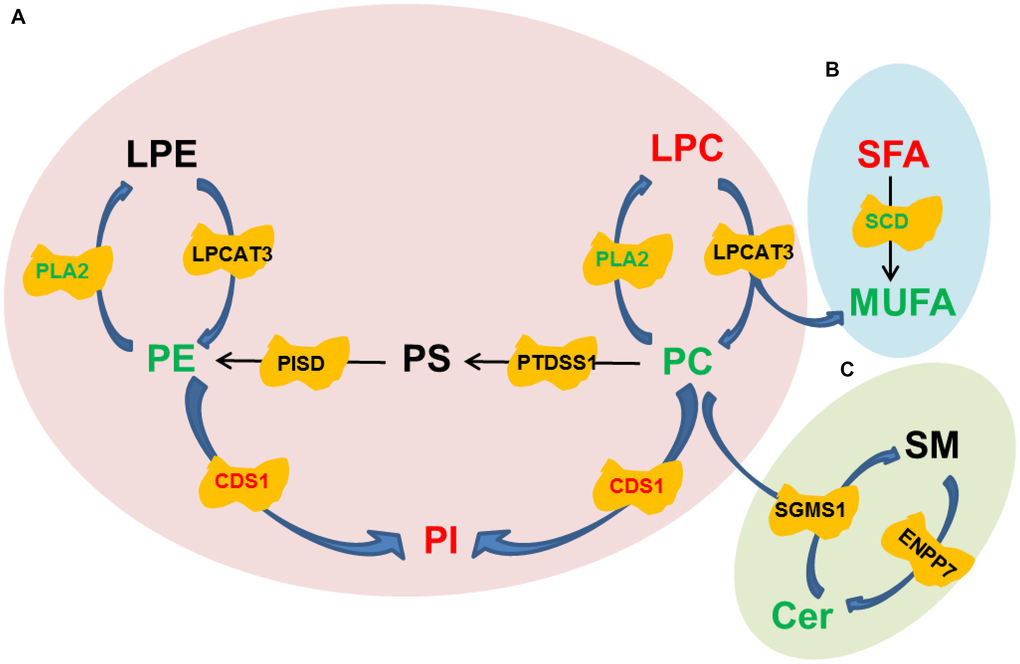
Figure 5.
Pathway diagrams constructed with various lipid species.
(
A
) Conversion among Glycerophospholipids. (
B
) Conversion between SFA and MUFA. (
C
) Conversion between SM and Cer.