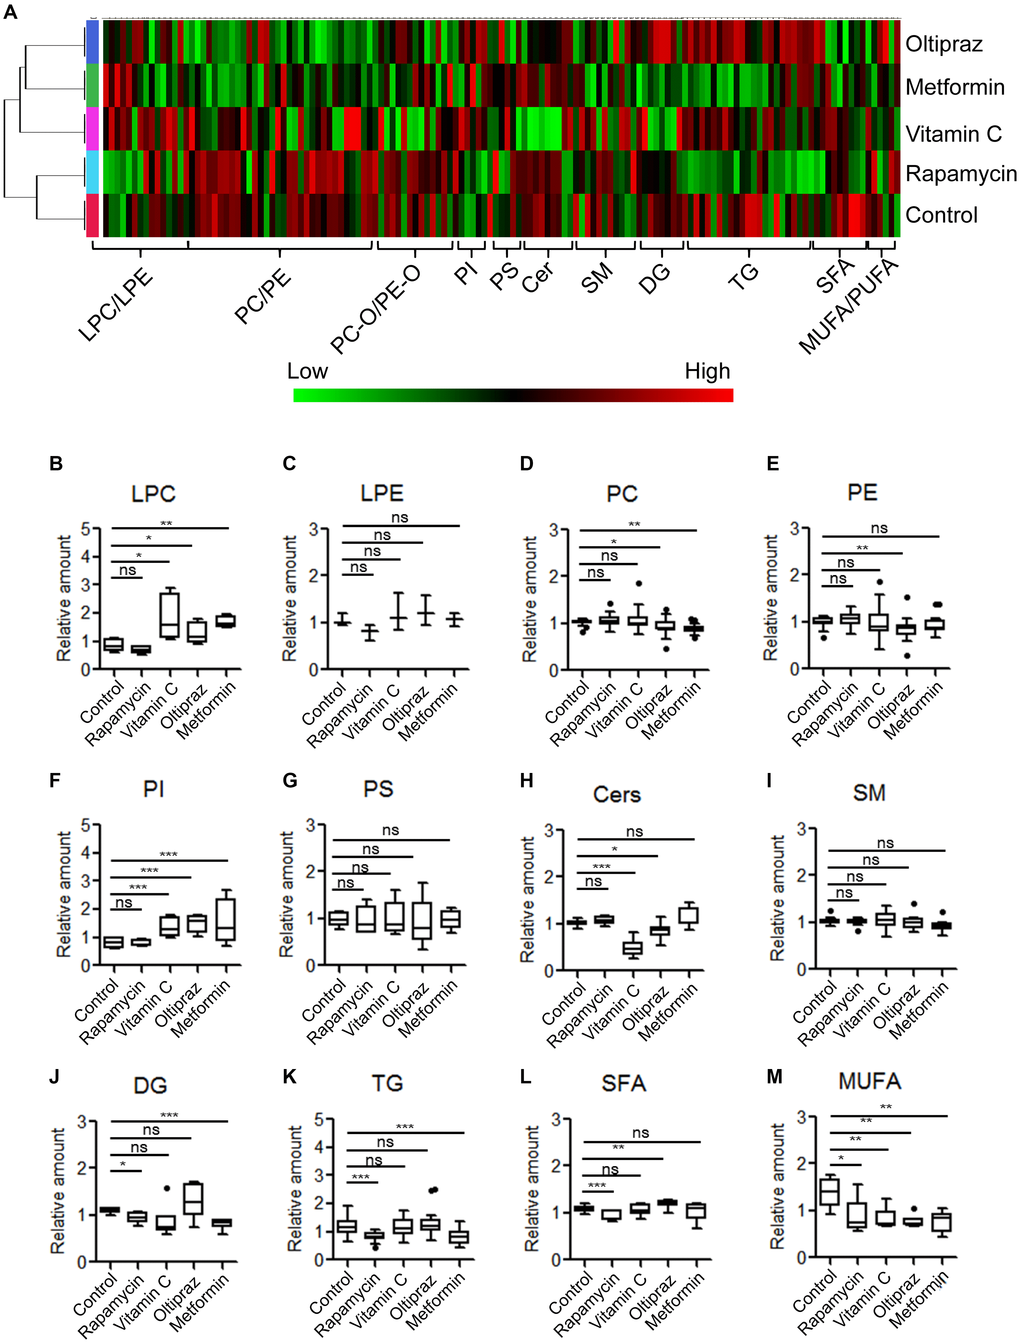
Figure 4.Metabolic alterations of lipid species among MSCs induced by different drugs. (A) Clustering-heatmap diagram indicated global alteration layout of various lipids among inducement groups. (B–M) Box plots showed differential significance of lipids between control and drug inducement groups.