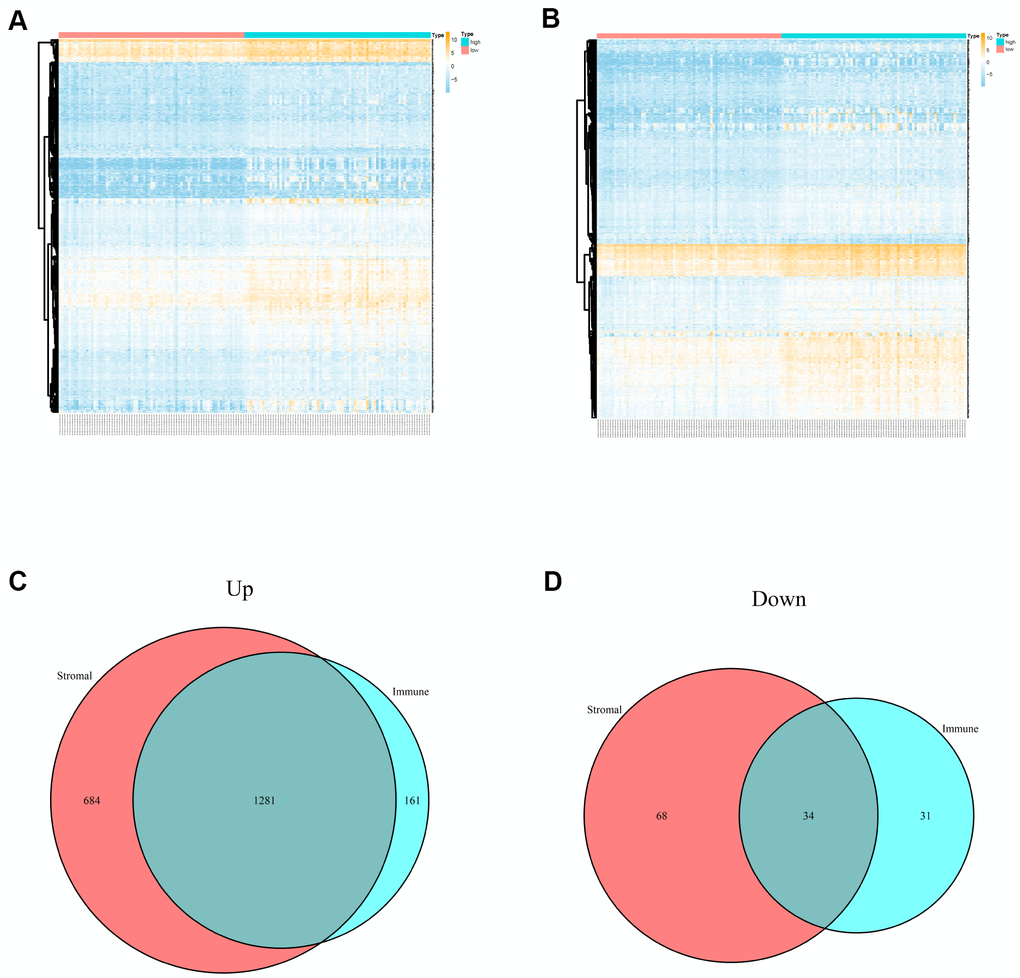
Figure 1.Differentially expressed genes of immune scores and stromal scores. (A) The heatmap of top 100 DEGs by comparing high scores with low scores of immune scores. (B) The heatmap of top 100 DEGs by comparing high scores with low scores of stromal scores. (C, D) Venn plots displaying co-upregulated and co-downregulated DEGs respectively.