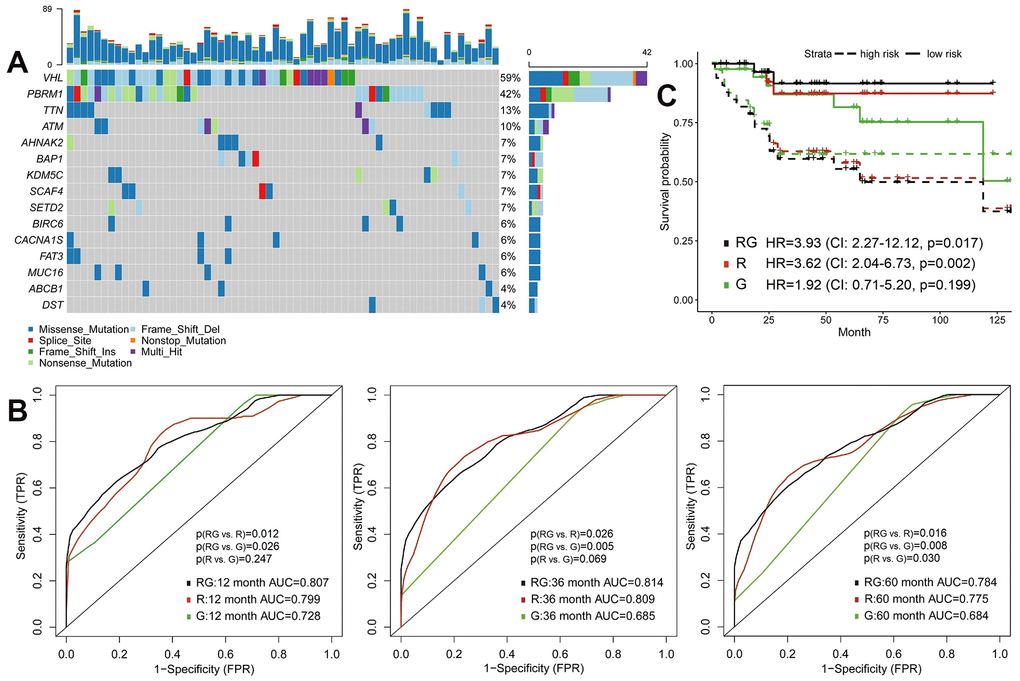
Figure 2.Predictive models of survival integrating radiomics with genomics features. (A) The waterfall plot of 20 most common somatic mutations in training set. (B) The 1-year, 3-year and 5-year area under the ROC of radiomics model (R), genomics model (G) and radiomics+genomics model (RG) in validation set. (C) Kaplan-Meier curves showed survival differences between high-risk and low-risk patients of validation set.