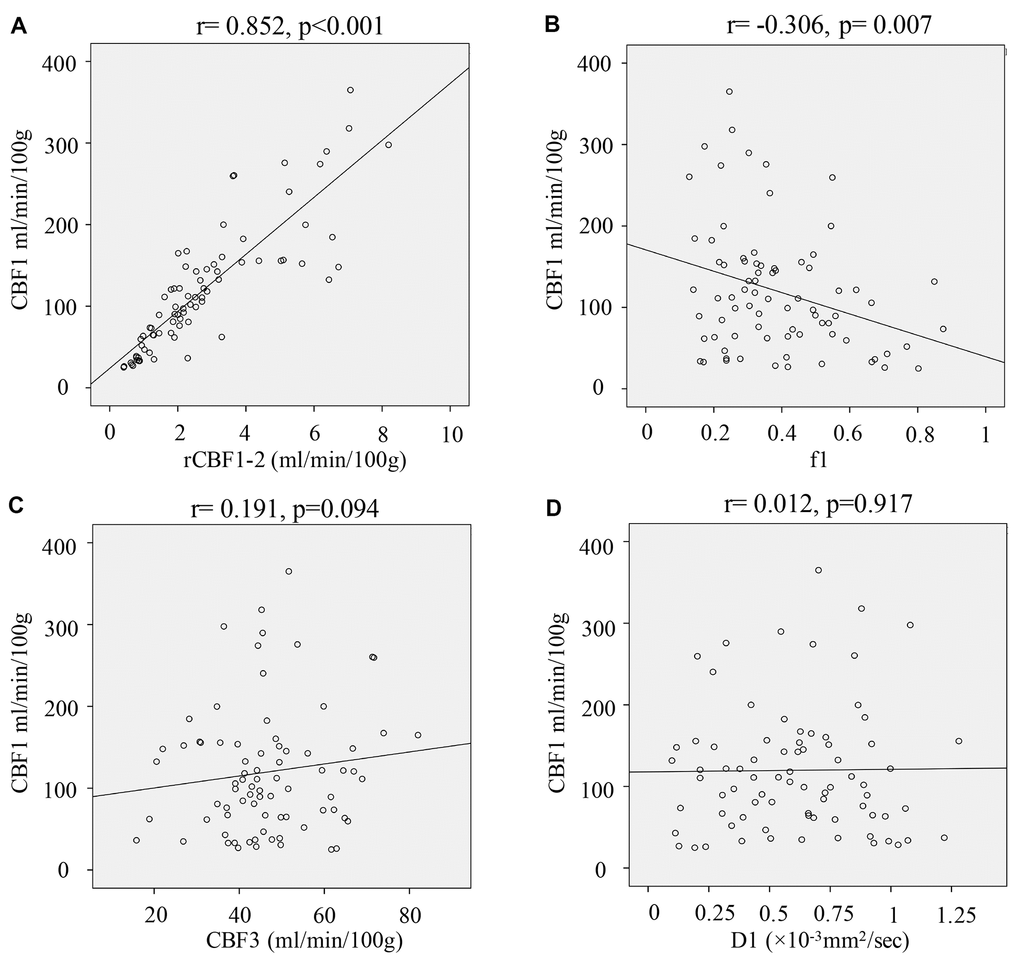
Figure 5.Correlation analysis of IVIM-DWI-derived parameters and CBF1. (A) Correlation analysis of rCBF1-2 and CBF1; (B) Correlation analysis of f1 and CBF1; (C) Correlation analysis of CBF3 and CBF1; (D) Correlation analysis of D1 and CBF1. (cerebral blood flow: CBF; the CBF of tumor parenchyma areas: CBF1; the CBF of mirror side normal areas: CBF2; the CBF of peritumoral areas: CBF3; rCBF1-2= CBF1/CBF2; rCBF3-2= CBF3/CBF2).