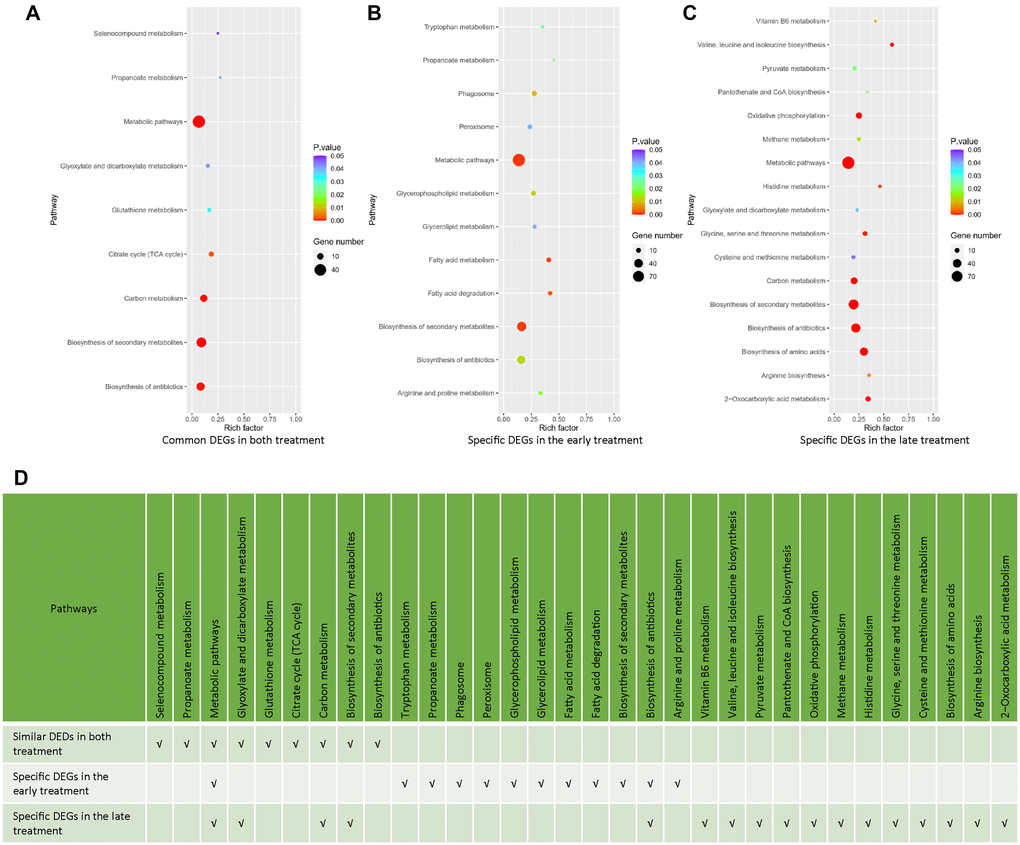
Figure 4.Analysis of common and specific DEGs in the early and late NaHS treatments. (A–C) The bubble charts representing KEGG enrichment analysis of common or specific DEGs in the early and late NaHS treatments. (D) Comparison of enriched pathways in (A–C).