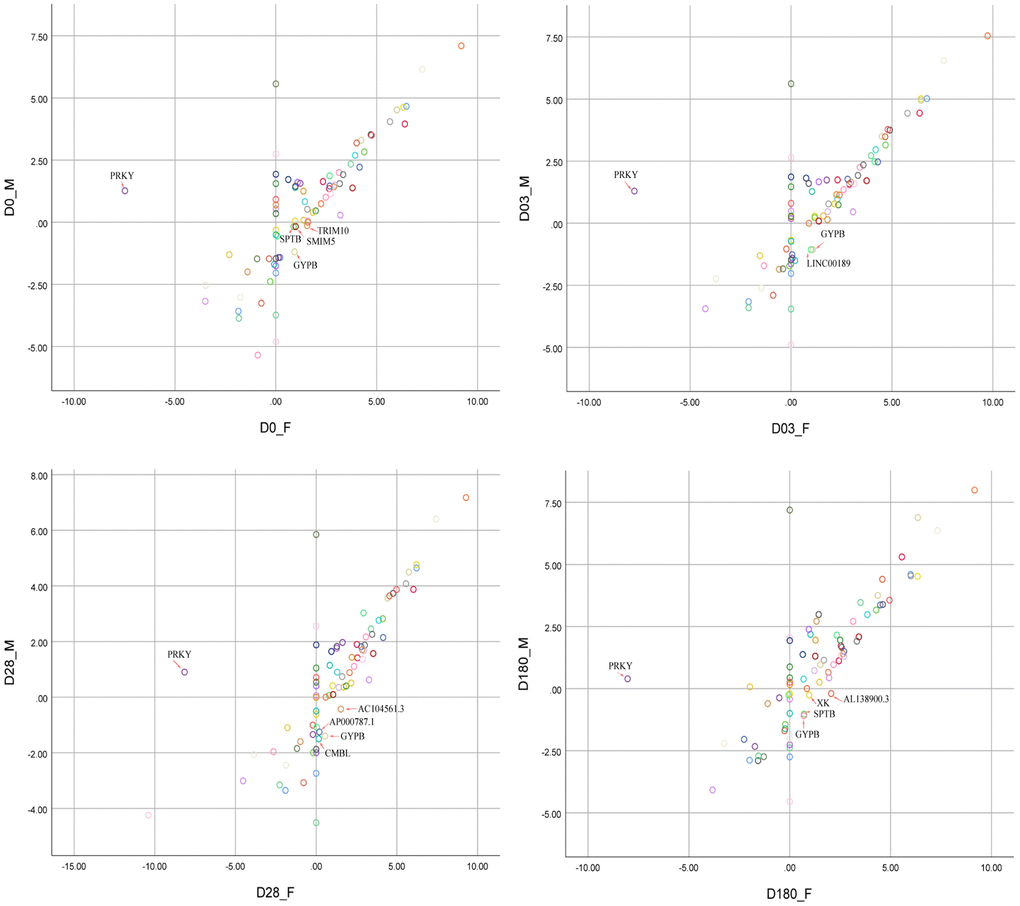
Figure 3.Scatter plot analysis of 80 DEGs between females and males at four time points (Day 0, Day 03, Day 28, Day 180). The red arrows pointed to the genes with significant sex-bias. FPKM values were normalized and transformed into Log2|FPKM| for visualization before scatter plot analysis.