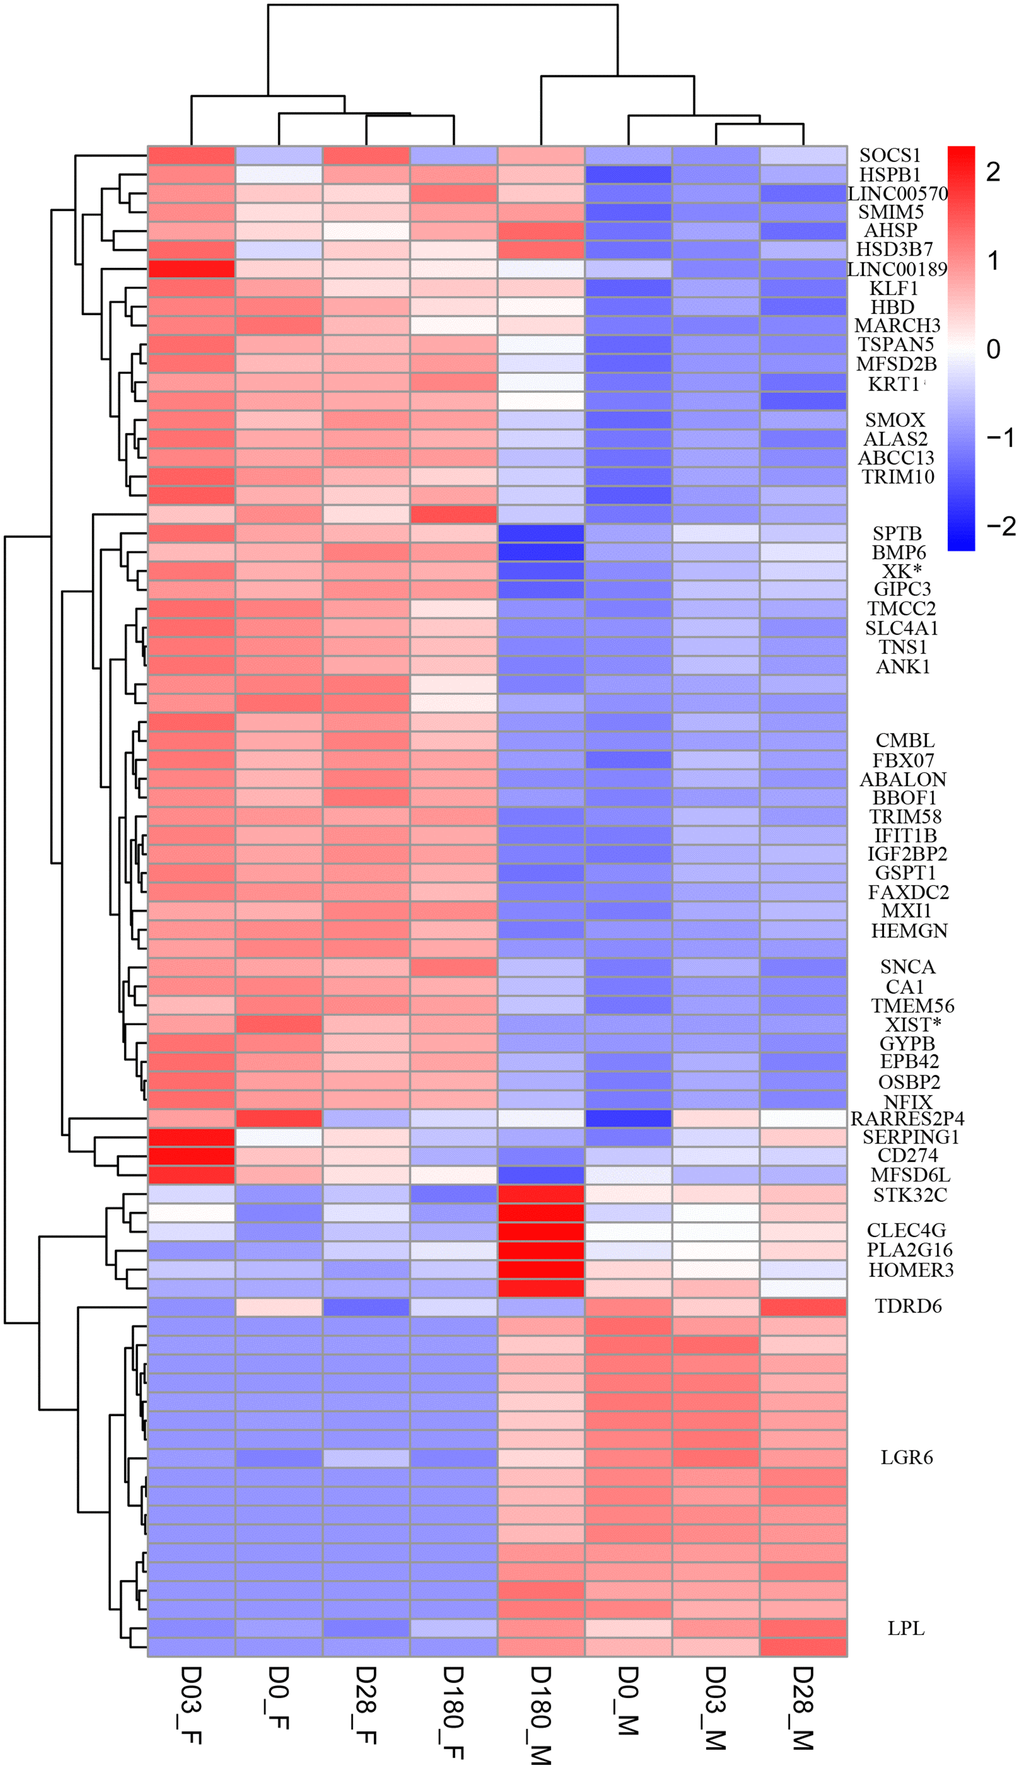
Figure 2.Heat map of DEGs between female and male group at Day 0 pre-vaccination, Day 03, Day 28 and Day 180 post-vaccination. The threshold was set with rigorous value for the FDR (false discovery rate, padj) < 0.01 and |log2fold change| > 1. Rows of the gene counts were normalized to set the mean =0, with the standard deviation (SD)=1. The upregulated genes were colored in red, while the downregulated genes were colored in blue.