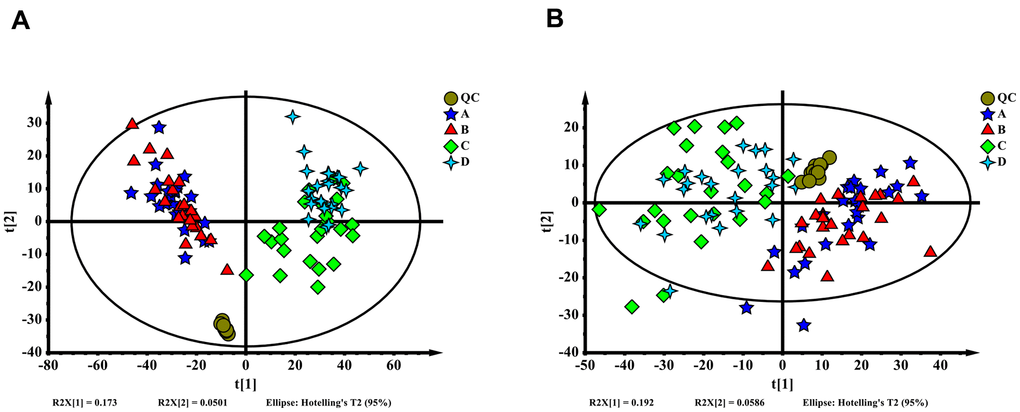
Figure 1.(A) Orthogonal partial least squares discriminant analysis (OPLS-DA) score plot of all samples (ESI+). (B) OPLS-DA score plot of all samples (ESI-). The QC, A, B, C and D represent the sample group in each mode, delayed PACU samples were A, enhanced PACU samples were B, delayed 24 hours samples were C, and enhanced 24 hours samples were D.