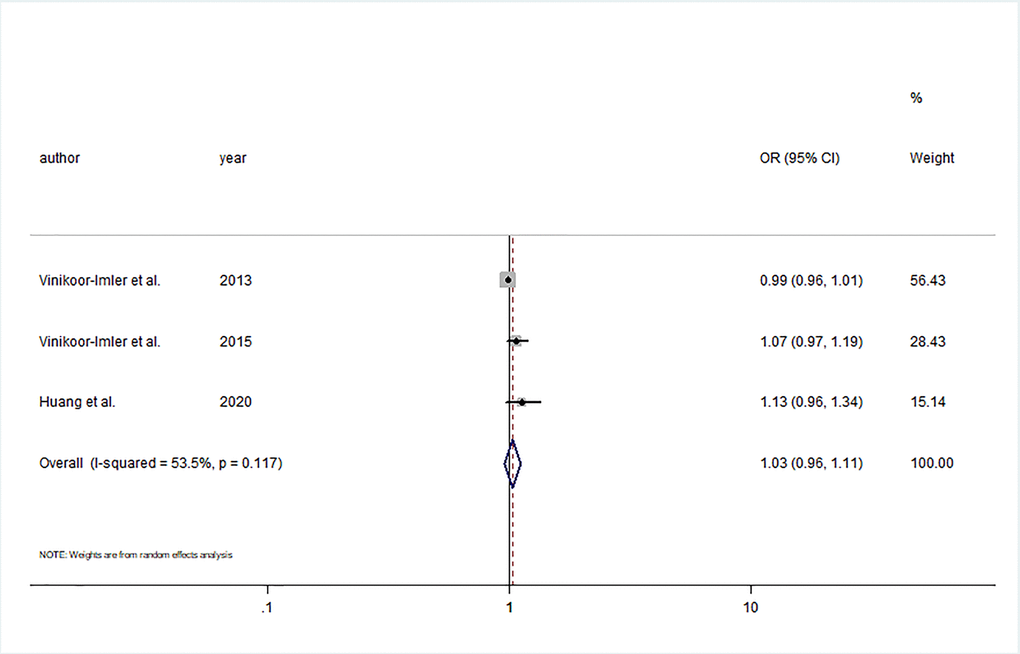
Figure 5.Forest plot of the association between per 5 ppb increment in O3 in first trimester and risk of hypospadias.
Figure 5 — Association between prenatal air pollution exposure and risk of hypospadias in offspring: a systematic review and meta-analysis of observational studies | Aging