Submit an Article
Navigate
Home
Editorial Board
Editorial Policies
Current Volume
Archive
Scientific Integrity
Publication Ethics Statements
Interviews with Outstanding Authors
Newsroom
Sponsored Conferences
Podcast
Contact
Special Collections
Submit an Article
Online ISSN: 1945-4589
Research Paper
|
Volume 13, Issue 6
|
pp. 8835–8848
Association between 4-dimension lifestyle pattern and 10-year mortality risk in Chinese individuals older than 65: a population-based cohort study
Back to article
Figure 2
(2 of 2)
−
100%
+
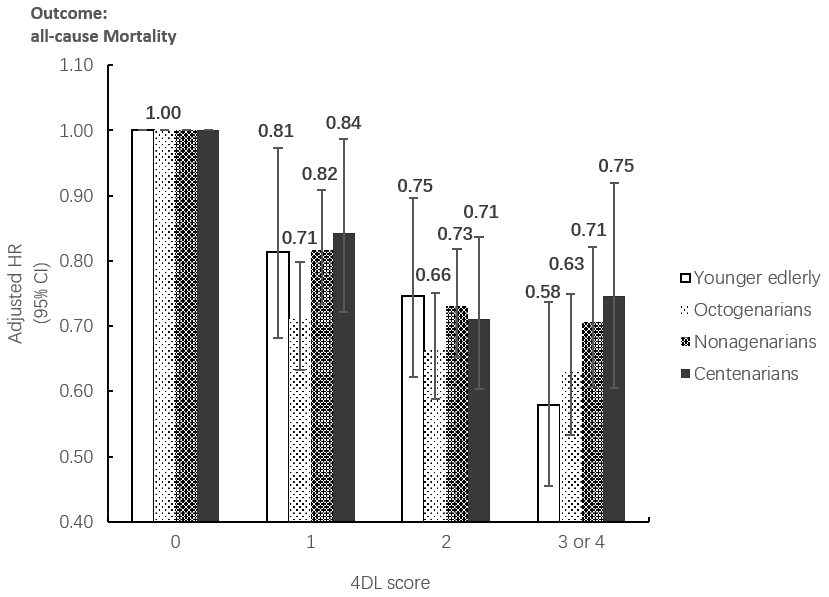
Figure 2.
Subgroup analysis between the association between 4DL and all-cause Mortality by age groups.
Data are represented as hazard ratios with 95% confidential interval.