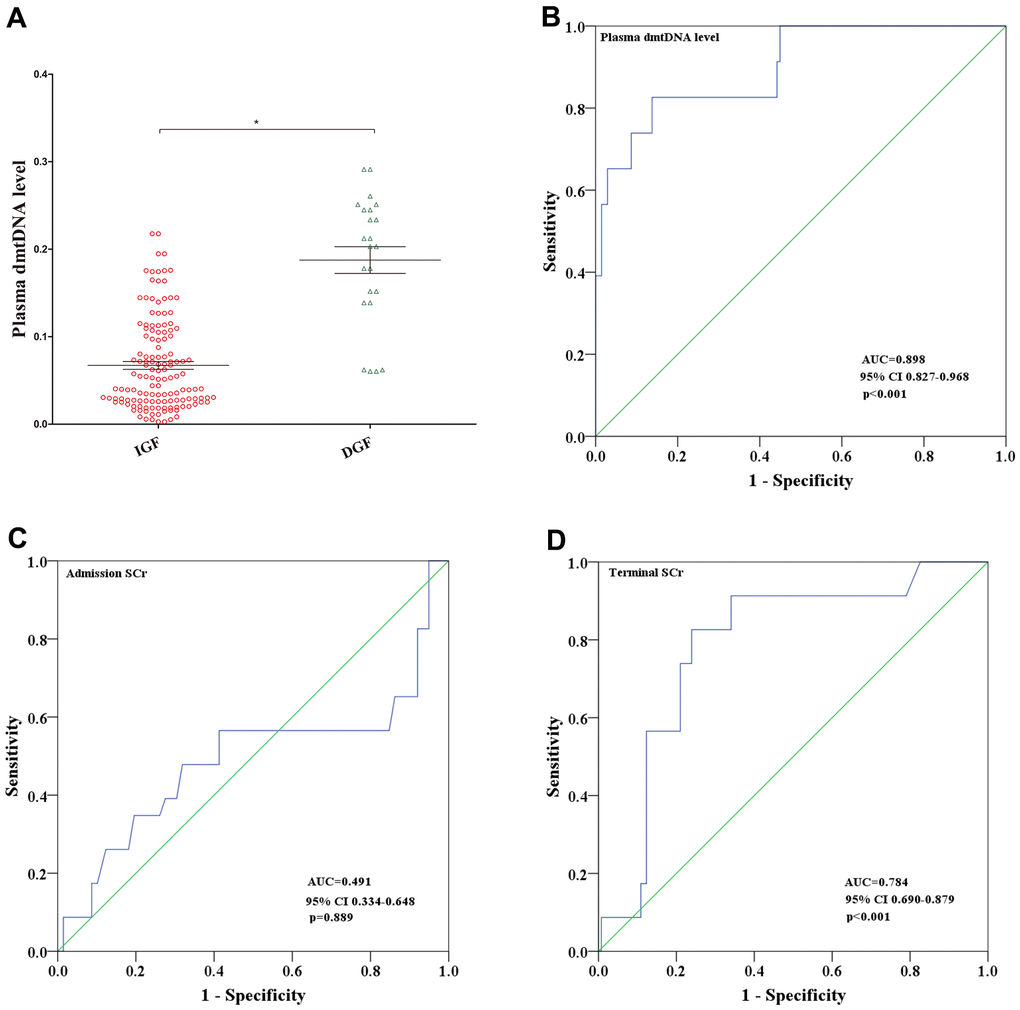
Figure 2.(A) Distribution of plasma dmtDNA in the delayed graft function (DGF) (n=23) and immediate graft function (IGF) (n=138) groups. (B–D) The receiver operating characteristic (ROC) curves of plasma dmtDNA (B), donor admission serum creatinine levels (C), and donor terminal serum creatinine levels (D).