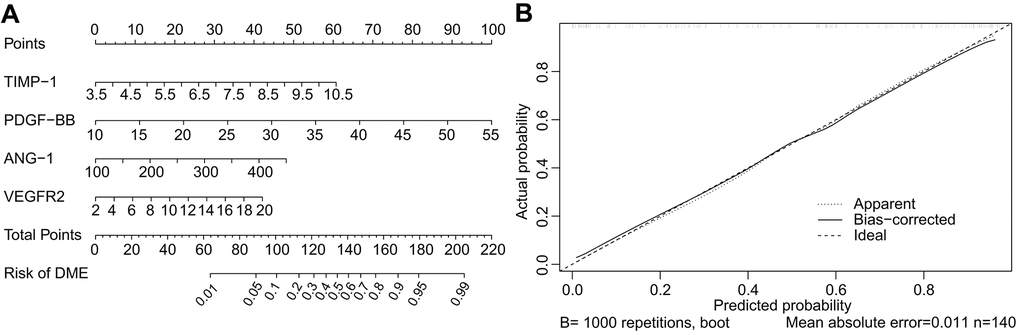
Figure 6.Nomogram and calibration curve for predicting DME. The DME-risk nomogram includes ANG-1, PDGF-BB, TIMP-1, and VEGFR2 as predictors (A). The calibration curve for predicting DME (B). The nomogram-predicted probability of DME is plotted on the X-axis and the actual probability is plotted on the Y-axis. Calibration curves demonstrated satisfactory consistency between the predicted risk and the actual probability.