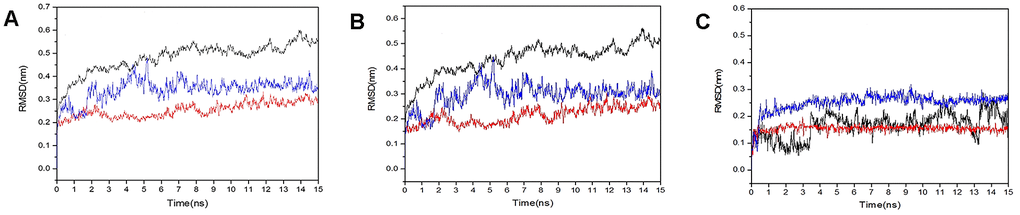
Figure 10.RMSD plot during molecular dynamics simulations. (A) The RMSD of protein-protein. (B) The RMSD of back bond-back bond. (C) The RMSD of ligand-ligand (blue polygonal line means licorice glycoside E and S protein, red polygonal line means xambioona and ACE2, black polygonal line means licorice glycoside E and Mpro).