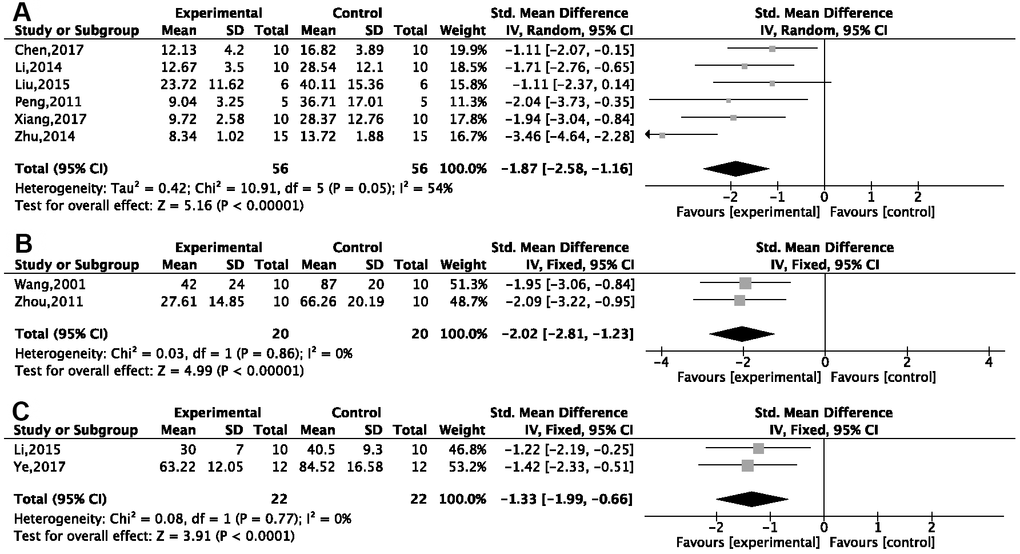
Figure 3.Forest plots of escape latency for the Morris water maze. This was seen to decrease in (A) the d-gal injection model; (B) the Aβ25-35 injection model; and (C) the Aβ1-42 injection model in the ginsenoside Rg1 group compared with a control group.