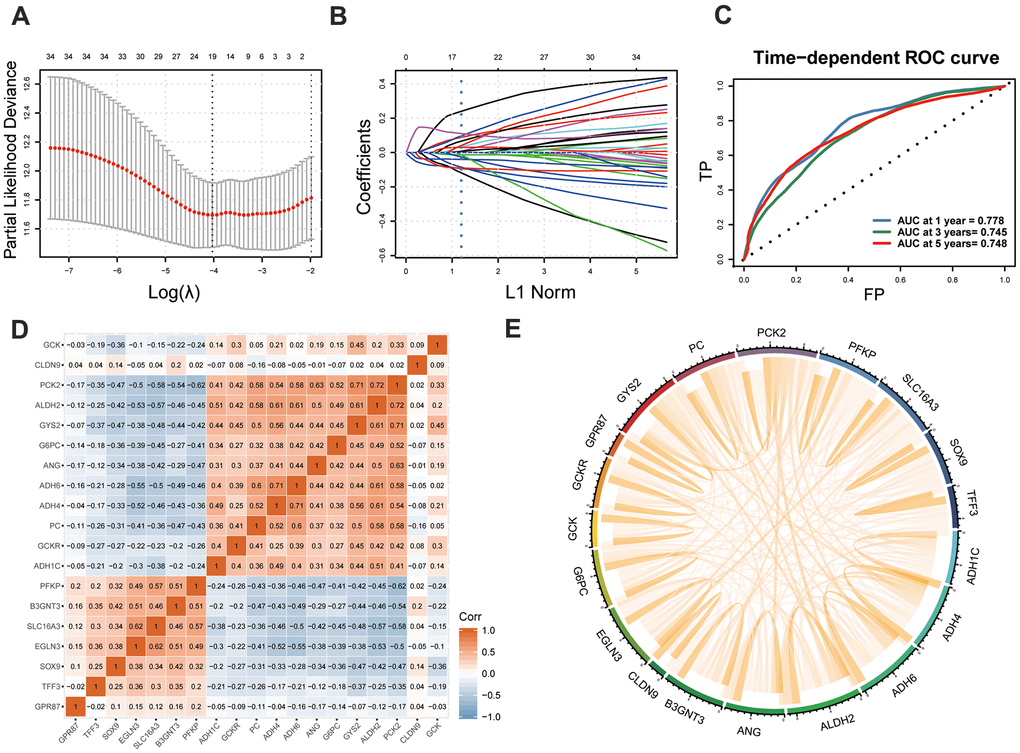
Figure 5.Development of GMPM. (A, B) LASSO regression analysis identified the 19 key MOG-DEGs in TCGA. (C) Time-dependent ROC curve analysis was performed to evaluate the diagnostic efficacy of GMPM. (D, E) The co-expression correlation between 19 key MOG-DEGs was showed. MOG-DEGs, multi-omics glycolysis-associated differentially expressed genes. ROC, receiver operating characteristic; GMPM, glycolysis-associated multi-omics prognostic model.