Submit an Article
Navigate
Home
Editorial Board
Editorial Policies
Current Volume
Archive
Scientific Integrity
Publication Ethics Statements
Interviews with Outstanding Authors
Newsroom
Sponsored Conferences
Podcast
Contact
Special Collections
Submit an Article
Online ISSN: 1945-4589
Research Paper
|
Volume 13, Issue 6
|
pp. 8095–8114
Expression and prognostic value of transcription-associated cyclin-dependent kinases in human breast cancer
Back to article
Figure 2
(2 of 9)
−
100%
+
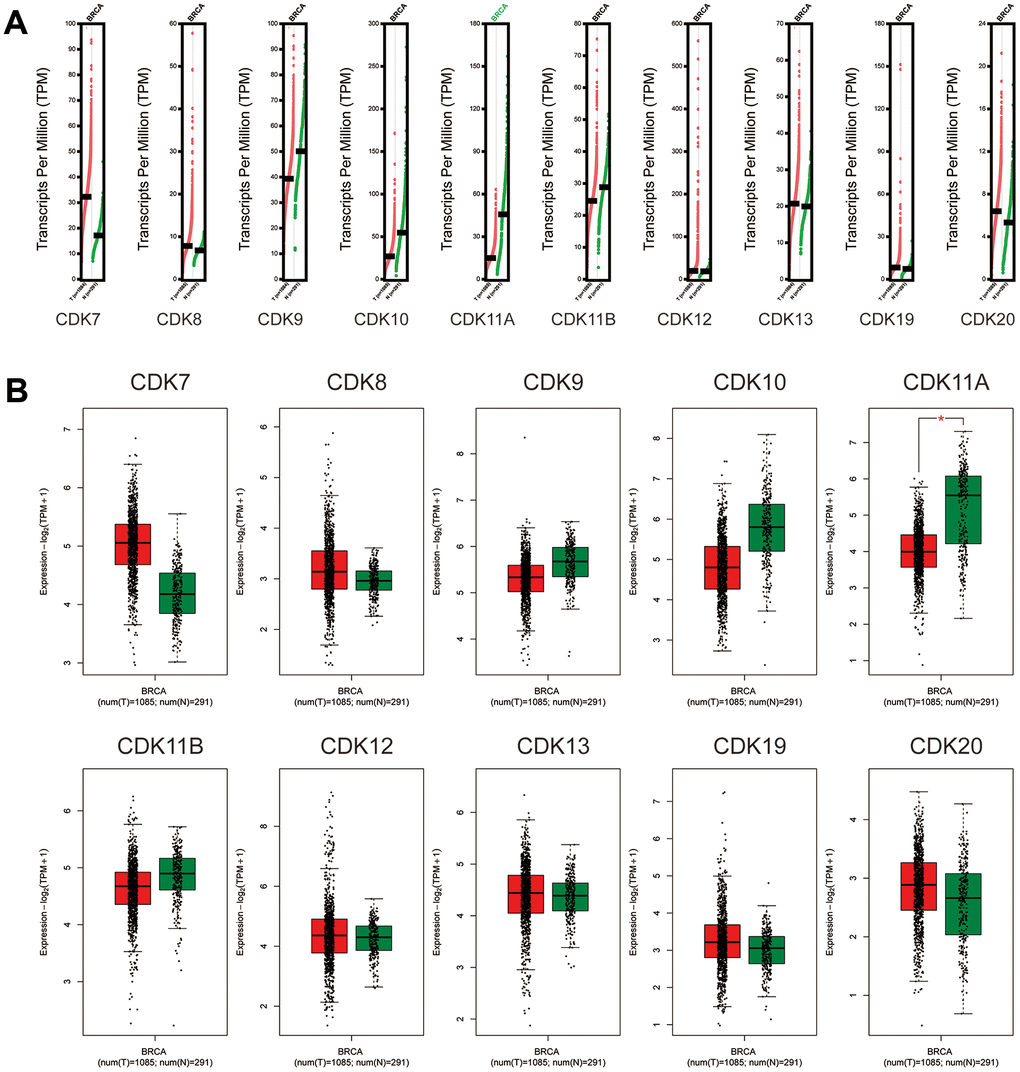
Figure 2.
Expression of TA-CDK mRNAs in breast cancer (GEPIA2).
(
A
) Scatter diagram. (
B
) Box plot. *P < 0.05.