Submit an Article
Navigate
Home
Editorial Board
Editorial Policies
Current Volume
Archive
Scientific Integrity
Publication Ethics Statements
Interviews with Outstanding Authors
Newsroom
Sponsored Conferences
Podcast
Contact
Special Collections
Submit an Article
Online ISSN: 1945-4589
Research Paper
|
Volume 13, Issue 4
|
pp. 6076–6090
Hsa_circ_0038383-mediated competitive endogenous RNA network in recurrent implantation failure
Back to article
Figure 1
(1 of 9)
−
100%
+
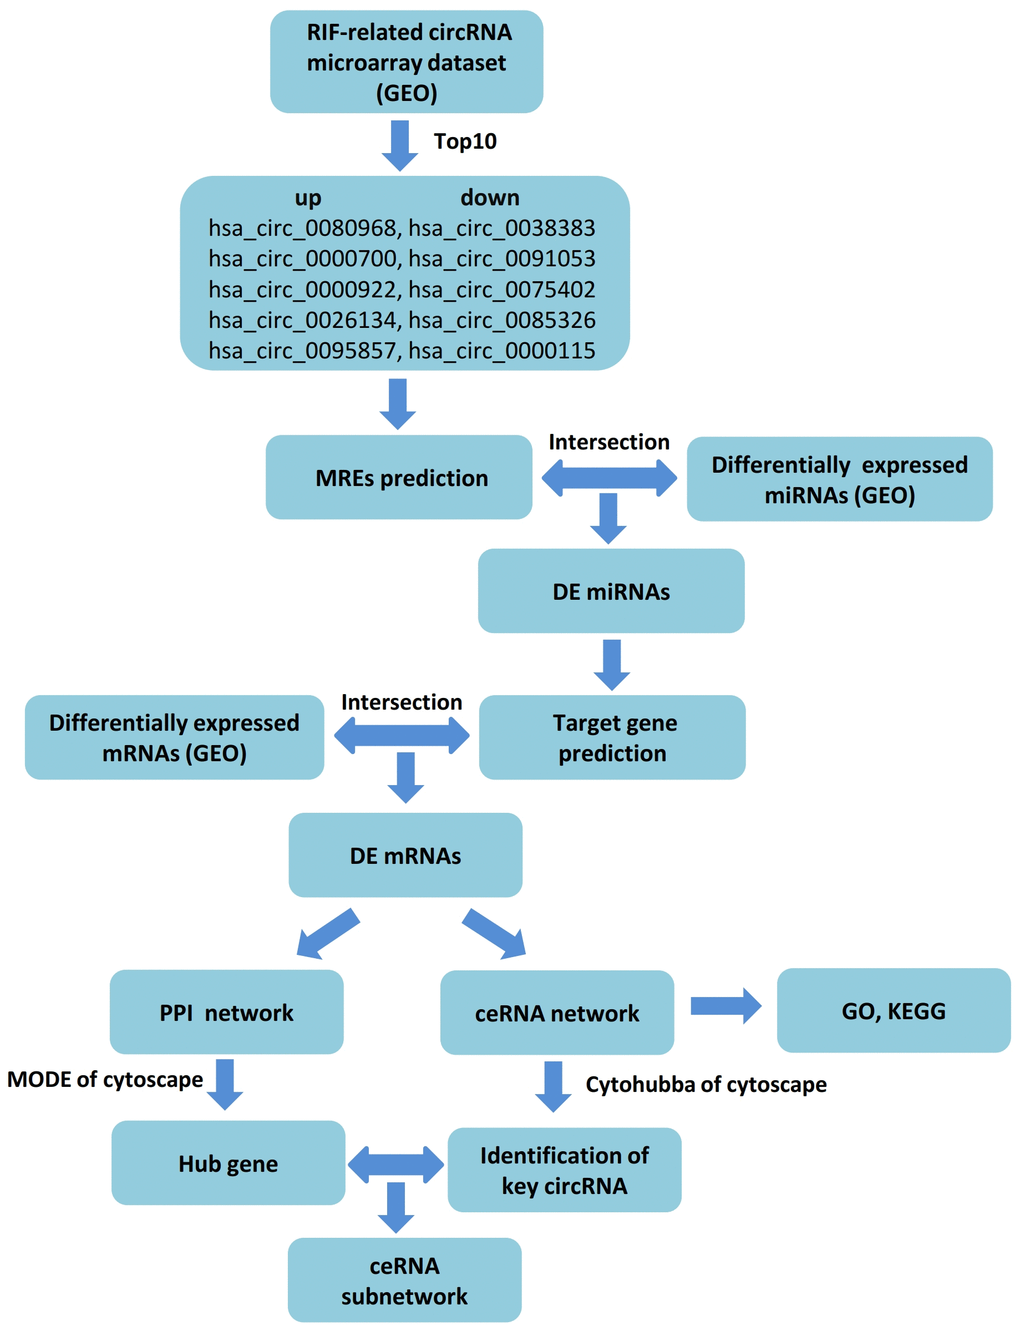
Figure 1.
Flow chart of the ceRNA network analysis.
Figure 1 — Hsa_circ_0038383-mediated competitive endogenous RNA network in recurrent implantation failure | Aging