Submit an Article
Navigate
Home
Editorial Board
Editorial Policies
Current Volume
Archive
Scientific Integrity
Publication Ethics Statements
Interviews with Outstanding Authors
Newsroom
Sponsored Conferences
Podcast
Contact
Special Collections
Submit an Article
Online ISSN: 1945-4589
Research Paper
|
Volume 13, Issue 3
|
pp. 4696–4712
Combined identification of
ARID1A
,
CSMD1
, and
SENP3
as effective prognostic biomarkers for hepatocellular carcinoma
Back to article
Figure 6
(7 of 8)
−
100%
+
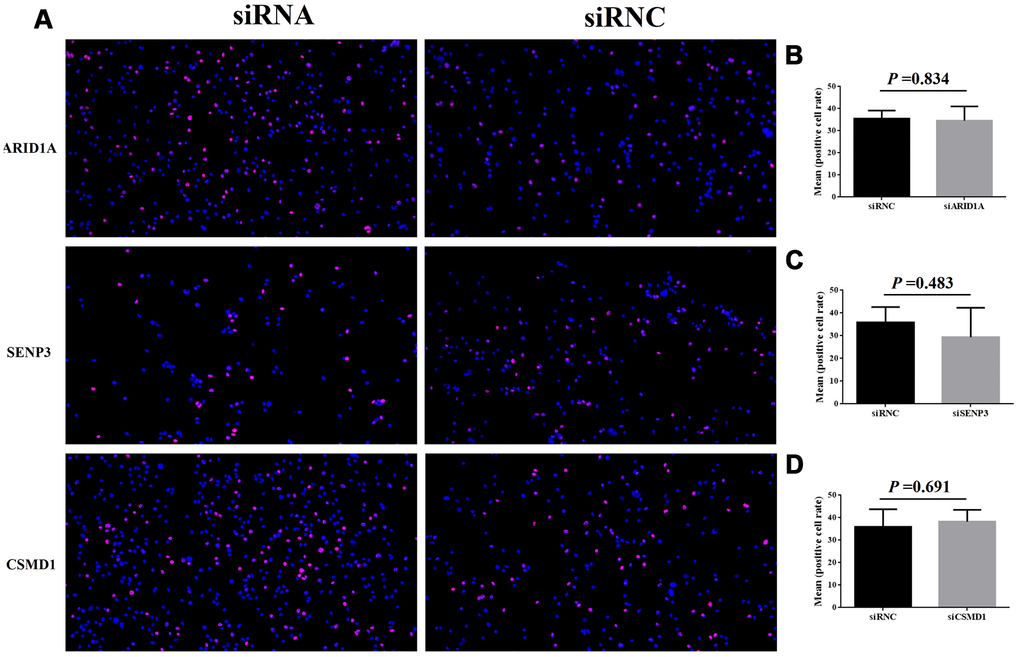
Figure 6.
Cell proliferation after the suppression of genes, ARID1A, CSMD1, and SENP3 by siRNA.
The images of EdU analysis shown in (
A
) were scanned, quantified, and plotted in (
B
–
D
, respectively).