Submit an Article
Navigate
Home
Editorial Board
Editorial Policies
Current Volume
Archive
Scientific Integrity
Publication Ethics Statements
Interviews with Outstanding Authors
Newsroom
Sponsored Conferences
Podcast
Contact
Special Collections
Submit an Article
Online ISSN: 1945-4589
Research Paper
|
Volume 13, Issue 5
|
pp. 7314–7329
Levodopa affects spike and local field synchronisation in the pedunculopontine nucleus of a rat model of Parkinson’s disease
Back to article
Figure 7
(7 of 7)
−
100%
+
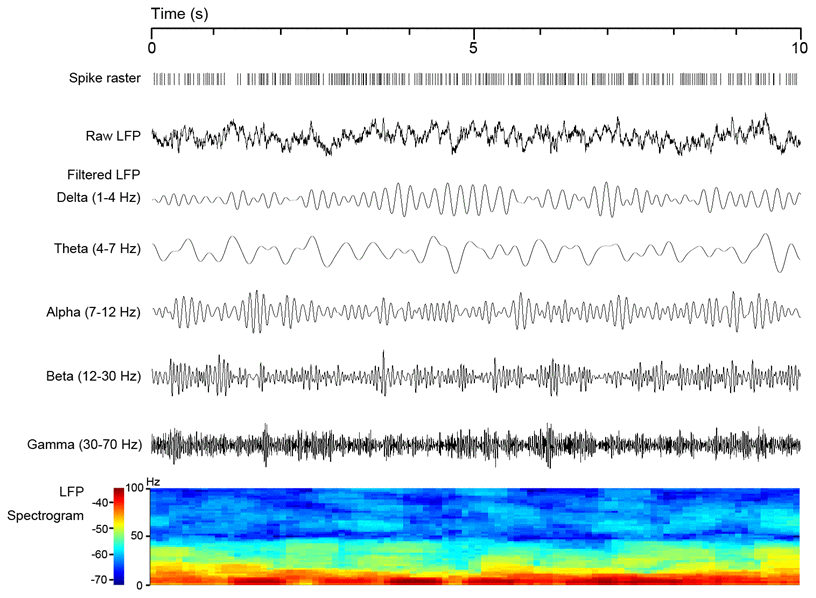
Figure 7.
Local field potential (LFP) filtering process is illustrated as a representative 10-s signal in resting state with synchronously recorded spike raster and an LFP spectrogram.