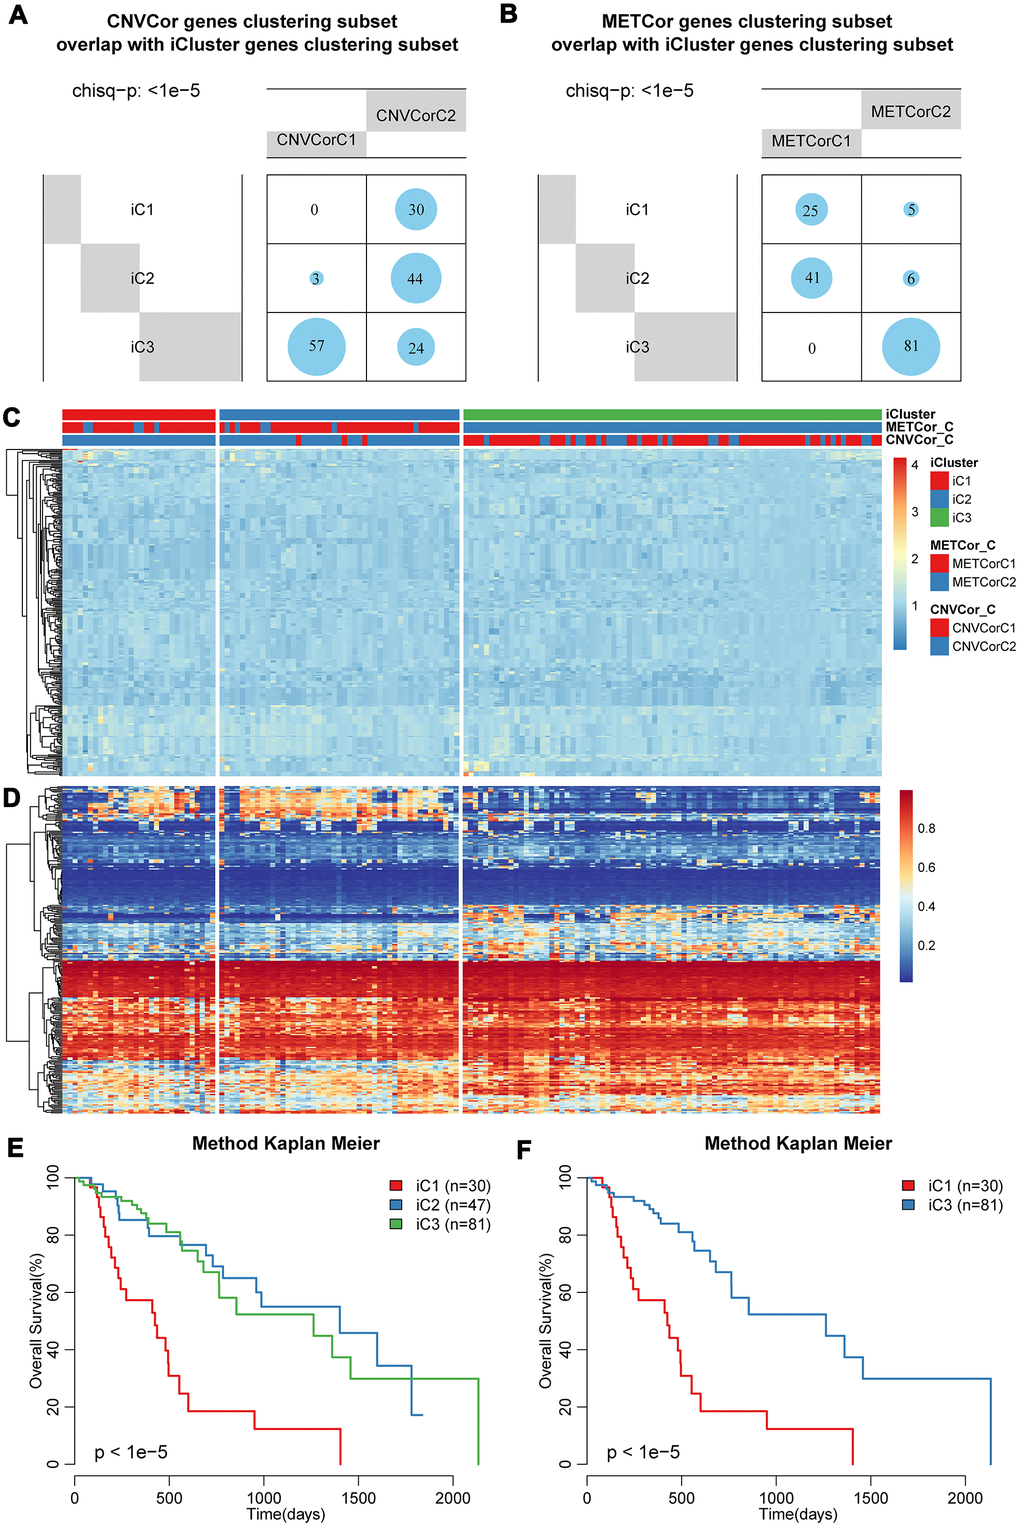
Figure 5.Identification of molecular subtypes based on multi-omics data. Overlapping of (A) CNV-G or (B) MET-G subtypes with iCluster subtypes. The landscape of (C) CNV and (D) methylation genes across all subtypes. Overall survival proportions for (E) each iCluster subtype or (F) between iC1 and iC3 subtype.