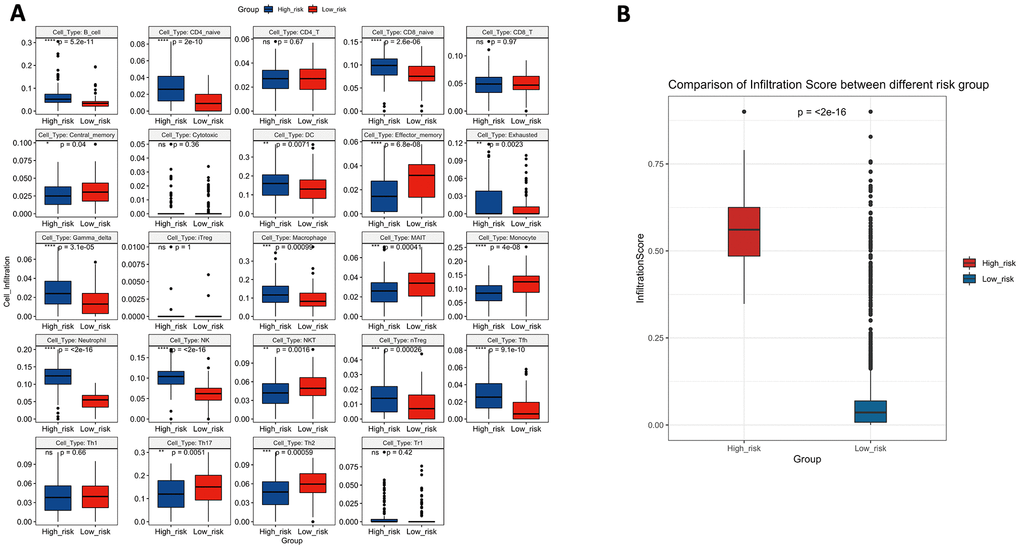
Figure 11.(A) The difference in tumour-infiltrating immune cells among risk groups as defined by the 10-lncRNA prognostic signature. (B) The difference in infiltration score among risk groups as defined by the 10-lncRNA prognostic signature.
Figure 11 — Identification of a ten-long noncoding RNA signature for predicting the survival and immune status of patients with bladder urothelial carcinoma based on the GEO database: a superior machine learning model | Aging