Submit an Article
Navigate
Home
Editorial Board
Editorial Policies
Current Volume
Archive
Scientific Integrity
Publication Ethics Statements
Interviews with Outstanding Authors
Newsroom
Sponsored Conferences
Podcast
Contact
Special Collections
Submit an Article
Online ISSN: 1945-4589
Research Paper
|
Volume 13, Issue 5
|
pp. 6866–6877
Association between body mass index and risk of cardiovascular disease-specific mortality among adults with hypertension in Shanghai, China
Back to article
Figure 4
(4 of 4)
−
100%
+
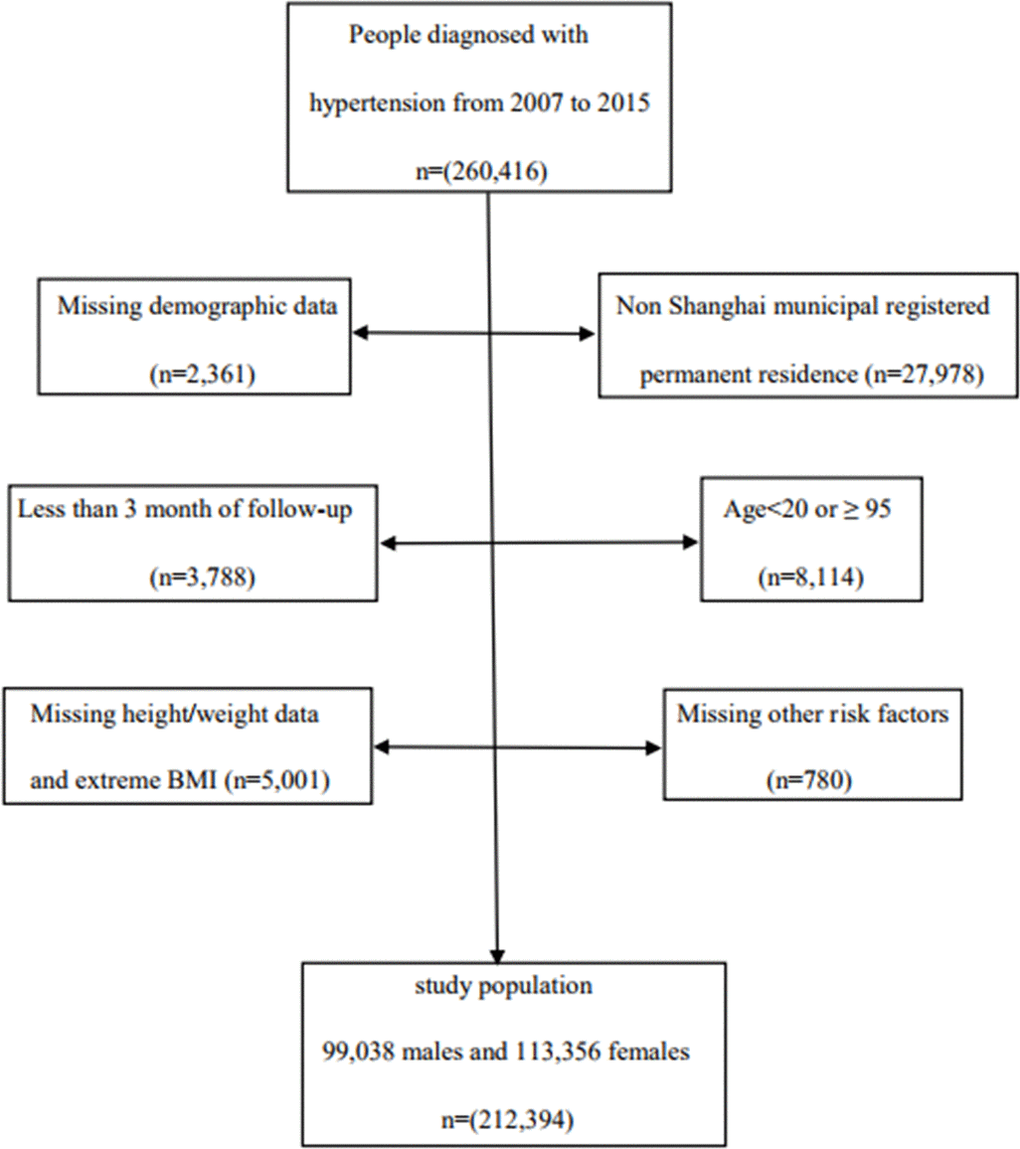
Figure 4.
Flow chart of study population.
Figure 4 — Association between body mass index and risk of cardiovascular disease-specific mortality among adults with hypertension in Shanghai, China | Aging