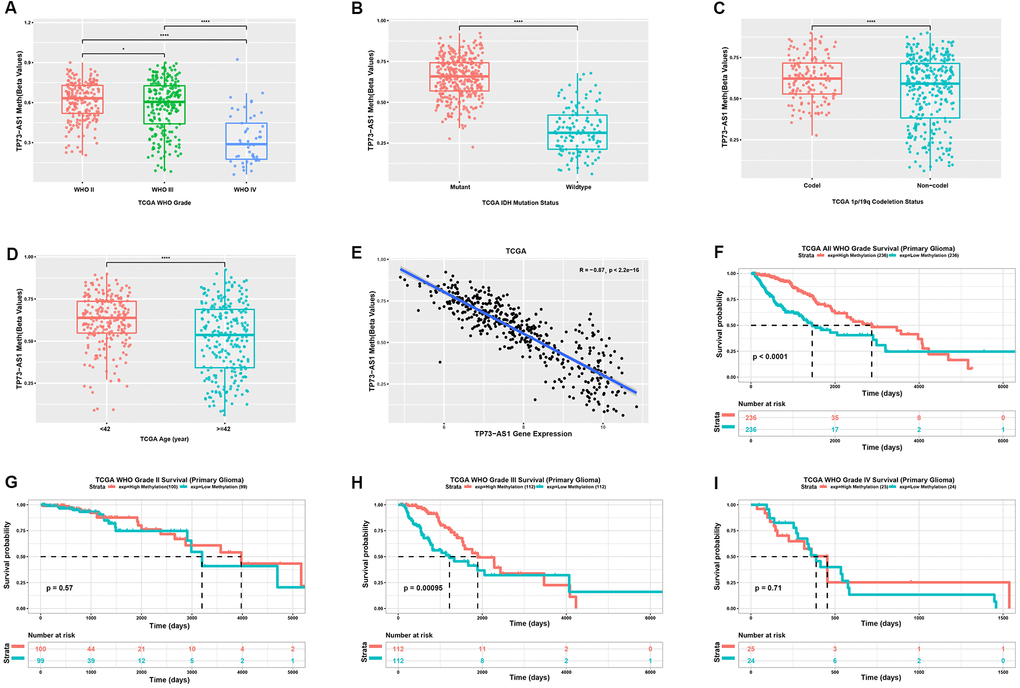
Figure 4.Analysis of the TP73-AS1 methylation level. (A) Methylation level of TP73-AS1 in different WHO grades in the TCGA dataset. (B) Methylation level of TP73-AS1 for different IDH statuses in the TCGA dataset. (C) Methylation level of TP73-AS1 for different 1p/19q statuses in the TCGA dataset. (D) Methylation level of TP73-AS1 for different age groups in the TCGA dataset. (E) Pearson’s correlation between the methylation level and mRNA expression of TP73-AS1. (F) Kaplan-Meier analysis of OS for the methylation level of TP73-AS1 for all WHO grades in the TCGA primary glioma dataset. (G) Kaplan-Meier analysis of OS for the methylation level of TP73-AS1 in WHO grade II in the TCGA primary glioma dataset. (H) Kaplan-Meier analysis of OS for the methylation level of TP73-AS1 in WHO grade III in the TCGA primary glioma dataset. (I) Kaplan-Meier analysis of OS for the methylation level of TP73-AS1 in WHO grade IV in the TCGA primary glioma dataset.