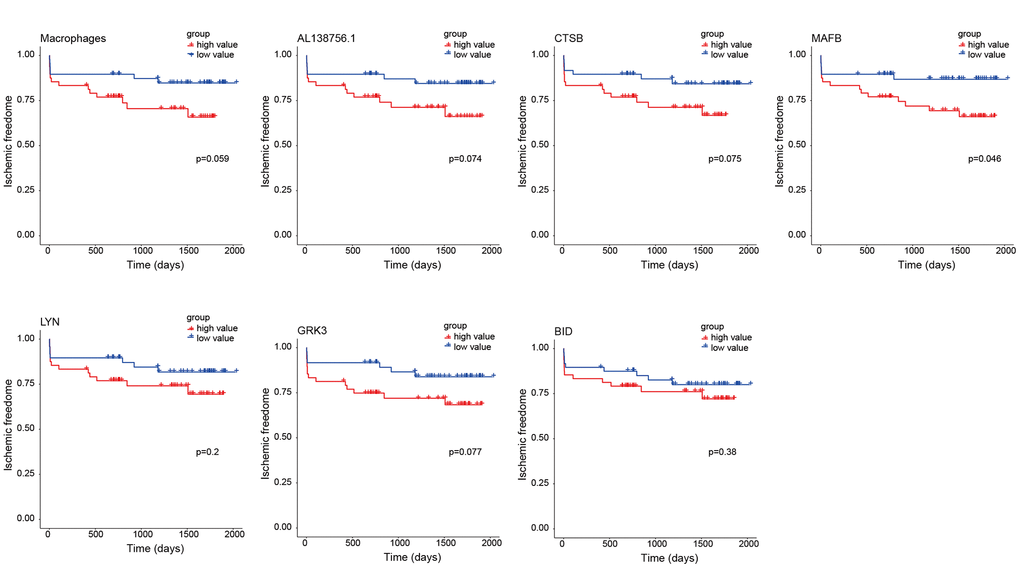
Figure 8.Kaplan-Meier survival curves of 7 factors in the macrophage related ceRNA subnetwork. The P-value was calculated by the log-rank test.
Figure 8 — Constructing a ceRNA-immunoregulatory network associated with the development and prognosis of human atherosclerosis through weighted gene co-expression network analysis | Aging