Submit an Article
Navigate
Home
Editorial Board
Editorial Policies
Current Volume
Archive
Scientific Integrity
Publication Ethics Statements
Interviews with Outstanding Authors
Newsroom
Sponsored Conferences
Podcast
Contact
Special Collections
Submit an Article
Online ISSN: 1945-4589
Research Paper
|
Volume 13, Issue 2
|
pp. 3010–3030
Efficacy of melatonin in animal models of intracerebral hemorrhage: a systematic review and meta-analysis
Back to article
Figure 3
(3 of 4)
−
100%
+
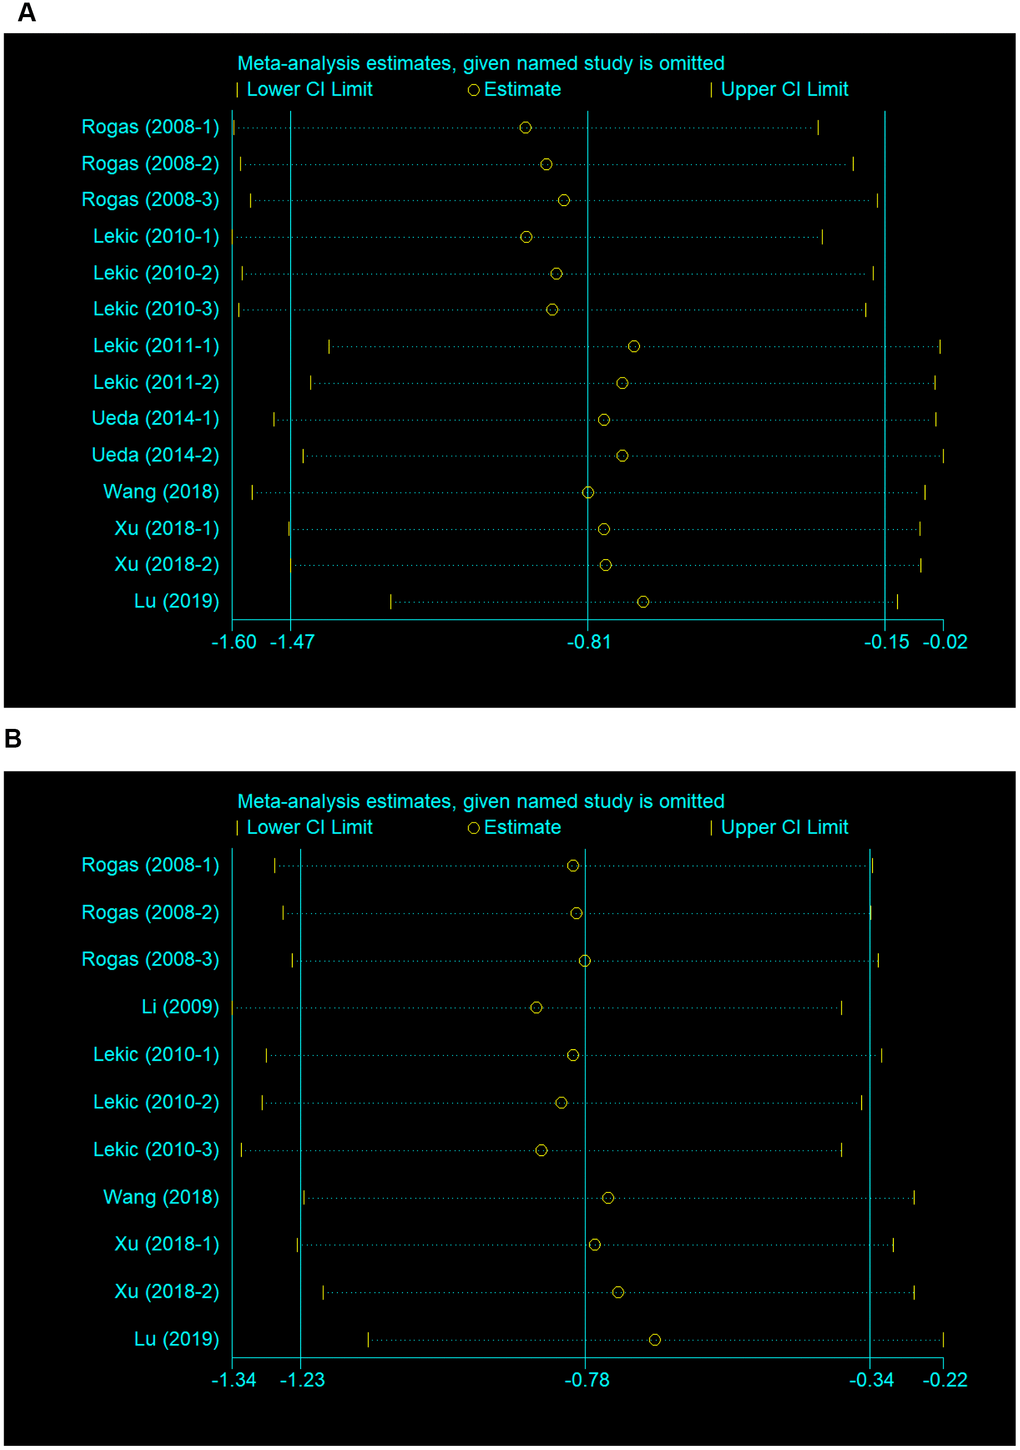
Figure 3.
Sensitivity analysis for the included comparisons.
Figures show mean effect size and 95 % CI for (
A
) neurobehavioral outcomes and (
B
) brain water content.