Submit an Article
Navigate
Home
Editorial Board
Editorial Policies
Current Volume
Archive
Scientific Integrity
Publication Ethics Statements
Interviews with Outstanding Authors
Newsroom
Sponsored Conferences
Podcast
Contact
Special Collections
Submit an Article
Online ISSN: 1945-4589
Research Paper
|
Volume 13, Issue 4
|
pp. 5197–5225
High expression of vinculin predicts poor prognosis and distant metastasis and associates with influencing tumor-associated NK cell infiltration and epithelial-mesenchymal transition in gastric cancer
Back to article
Figure 3
(3 of 10)
−
100%
+
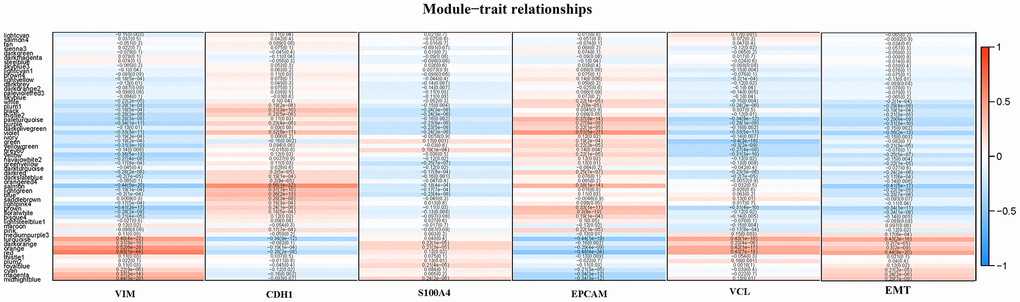
Figure 3.
A heat map of the correlation between module eigengenes and the status of VIM, CDH1, S100A4, EPCAM, VCL expression and EMT.