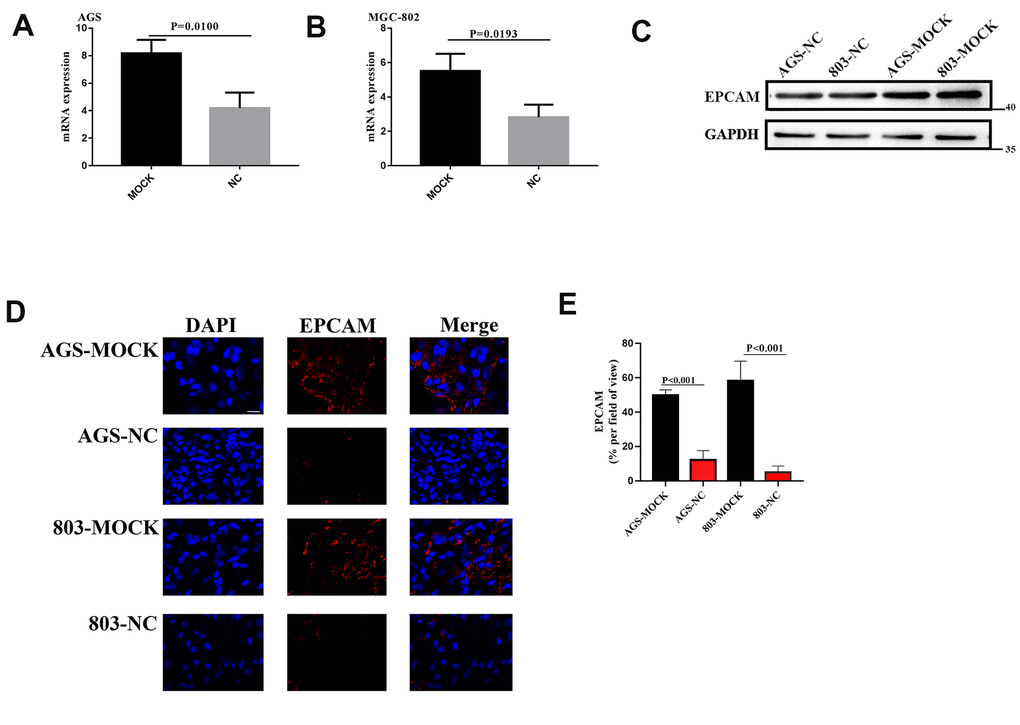
Figure 10.(A, B) The EPCAM RNA expression of VCL silent group and blank group. (C) The EPCAM expression of VCL silent group and blank group. (D) Representative images of EPCAM (red) and DAPI (bule) formation in silent group and blank group cells. Scale bars, 10 mm. (E), proportion of EPCAM+ cells in tumor in (D).