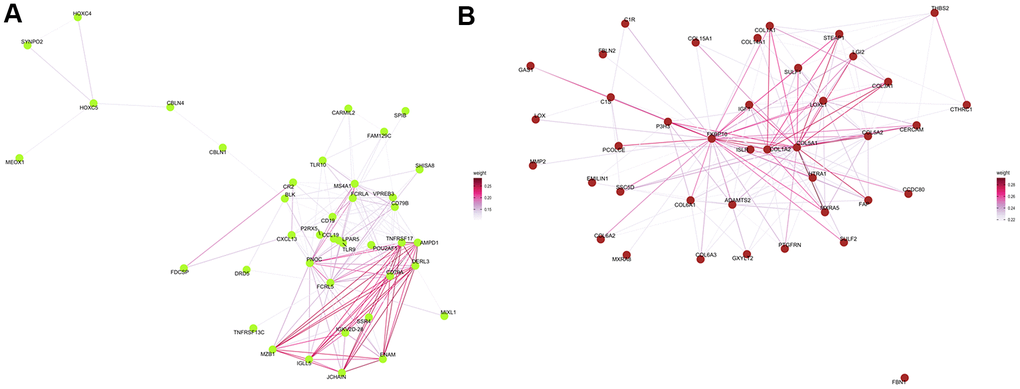
Figure 7.Protein–protein interaction network analysis. Visualization of the network connections among the most highly connected genes within the green-yellow (A) and brown (B) modules. Edge weights represent similarity between nodes.
Figure 7 — Identification of hub genes and key pathways in the emphysema phenotype of COPD | Aging