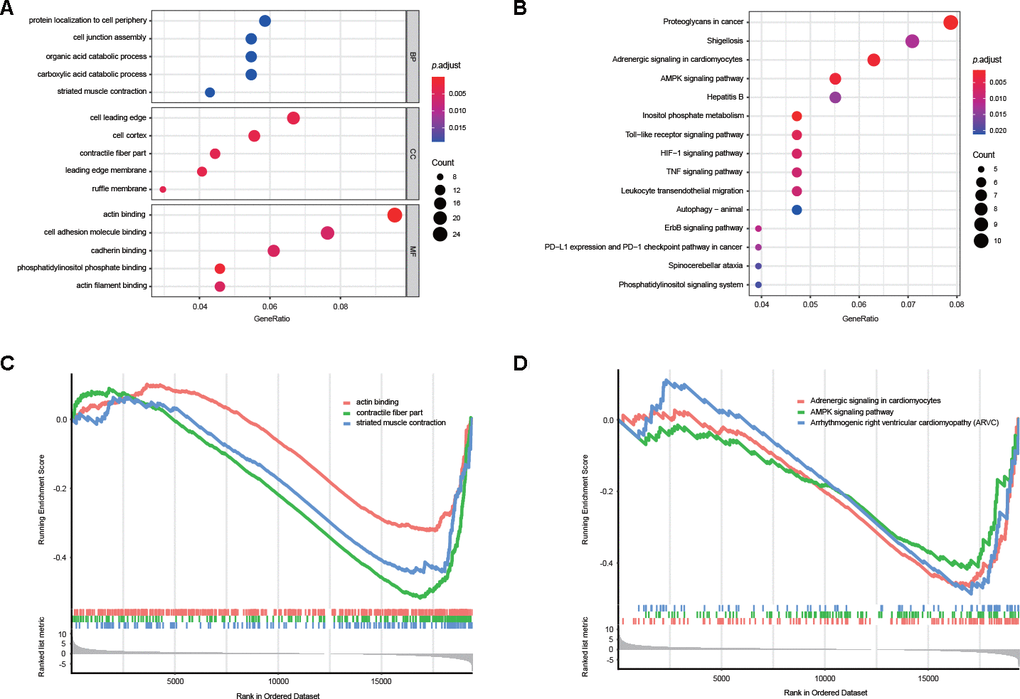
Figure 3.Potential biological functions of DEAS events. (A) GO analysis of DEAS events is shown in bubble plots. (B) KEGG analysis of DEAS events is shown in bubble plots. (C, D) GSEA of DEAS events.
Figure 3 — The landscape of alternative splicing reveals novel events associated with tumorigenesis and the immune microenvironment in gastric cancer | Aging