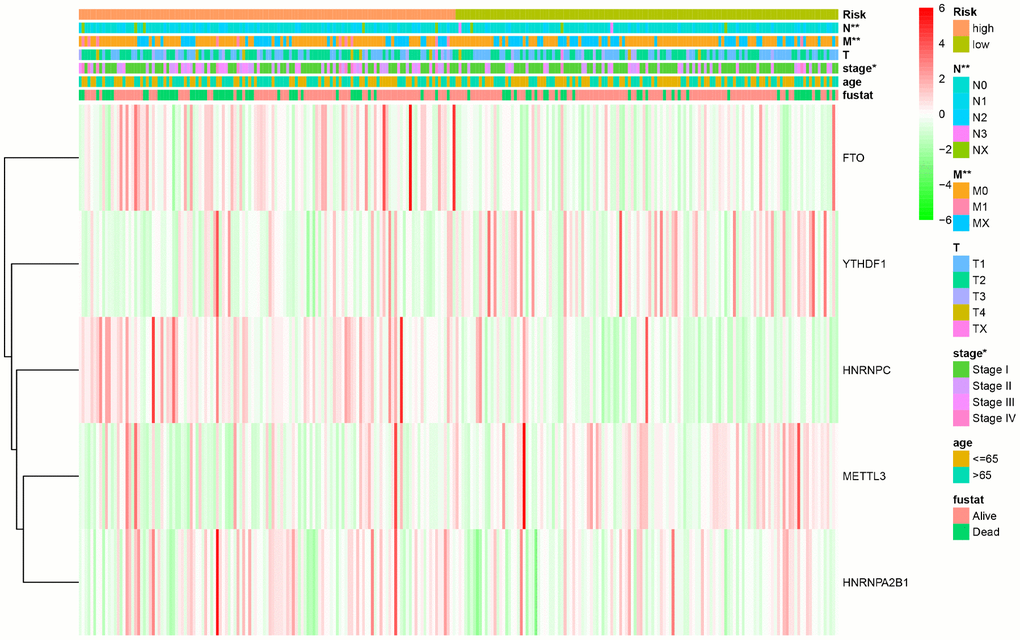
Figure 4.The relationship between the risk score and different clinical traits (* represents p < 0.05, ** represents p < 0.01, and *** represents p < 0.001).
Figure 4 — Gene signatures of 6-methyladenine regulators in women with lung adenocarcinoma and development of a risk scoring system: a retrospective study using the cancer genome atlas database | Aging