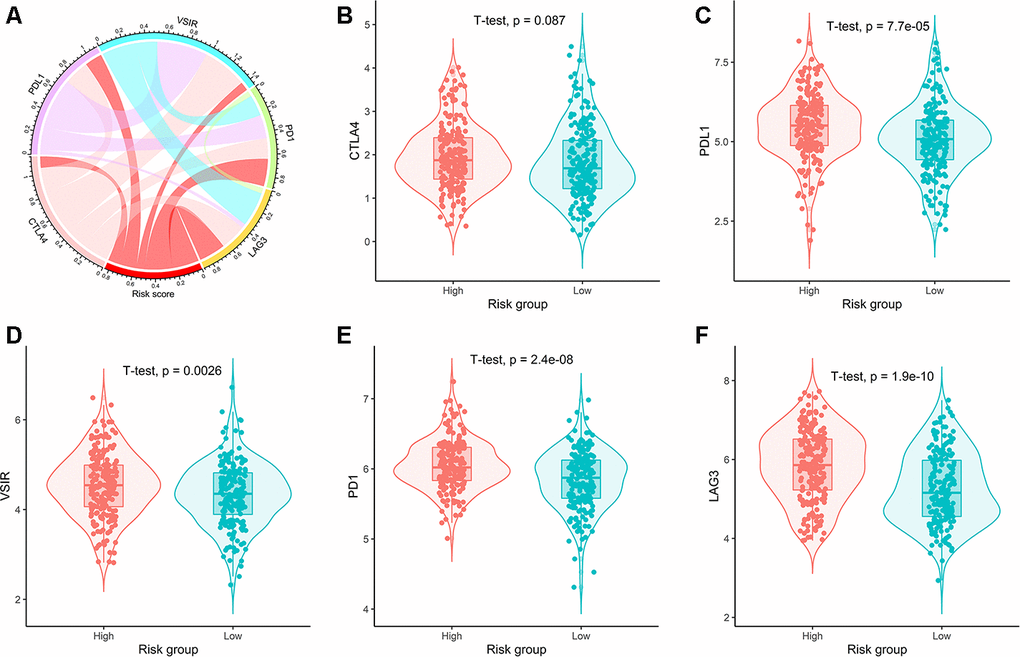
Figure 8.Correlation of risk scores with expression of five prominent immune checkpoints. (A) Circular plot visualizing correlation coefficient of risk scores with expression of five common immune checkpoints. Box plots showing comparison of the expression of (B) CTLA4, (C) PDL1, (D) VSIR, (E) PD1, and (F) LAG3 between high- and low-risk groups.