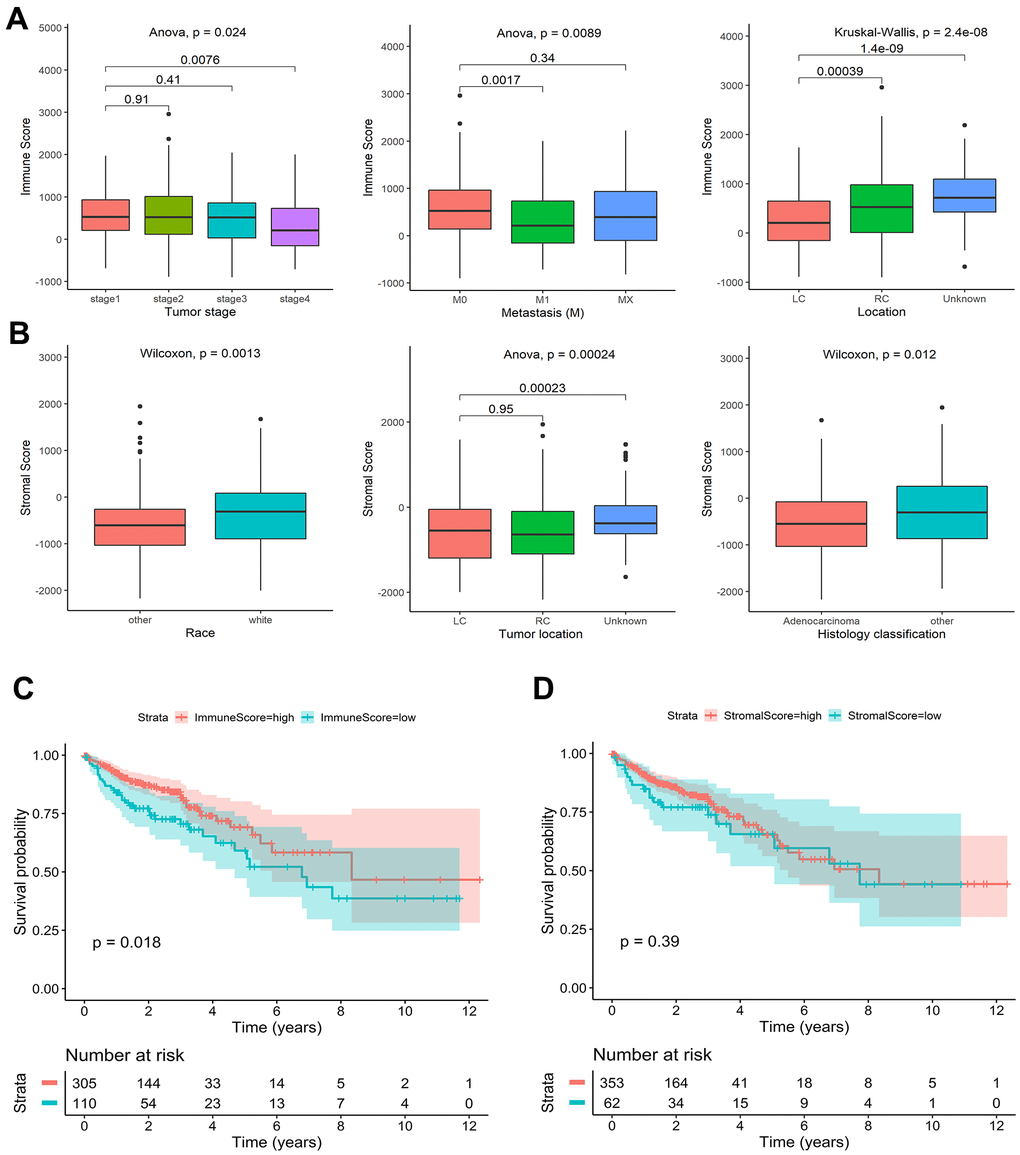
Figure 1.Association of stromal and immune scores with colon cancer clinical characteristics and prognosis in TCGA. (A) Significant differences in the distribution of immune scores among different tumor stage, metastasis, and tumor location groups. (B) Significant differences in the distribution of stromal scores among different race, tumor location, and histology classification groups. (C) Kaplan-Meier survival curves of high and low immune score groups. (D) Kaplan-Meier survival curves of high and low stromal score groups.