Submit an Article
Navigate
Home
Editorial Board
Editorial Policies
Current Volume
Archive
Scientific Integrity
Publication Ethics Statements
Interviews with Outstanding Authors
Newsroom
Sponsored Conferences
Podcast
Contact
Special Collections
Submit an Article
Online ISSN: 1945-4589
Research Paper
|
Volume 13, Issue 1
|
pp. 1264–1275
A model integrating donor gene polymorphisms predicts fibrosis after liver transplantation
Back to article
Figure 1
−
100%
+
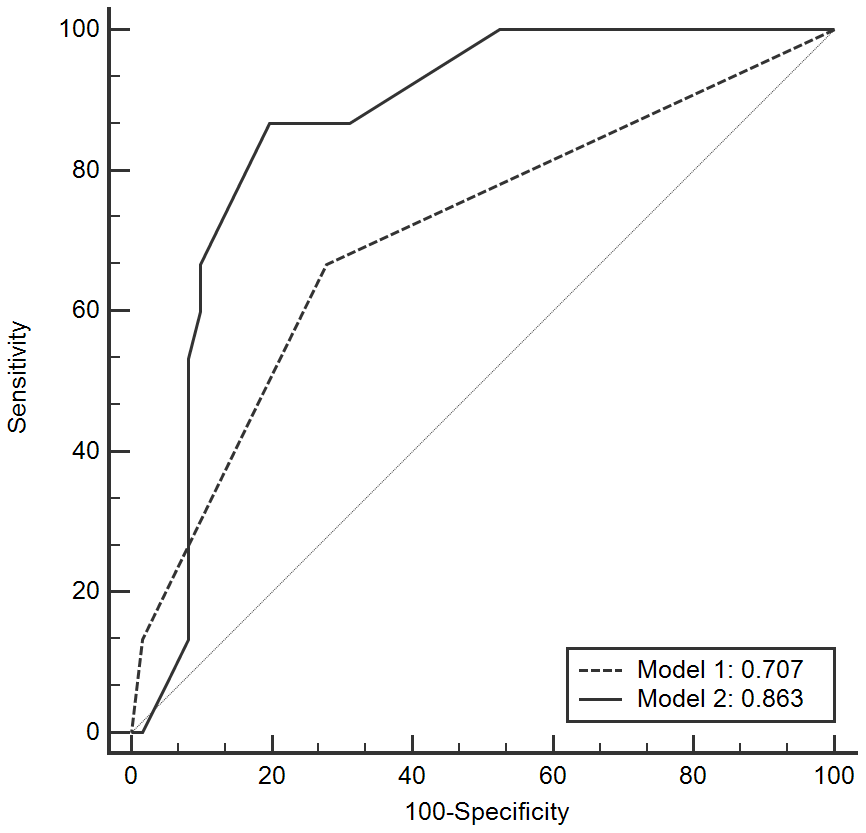
Figure 1.
ROC curves of the model to predict LF after LT.
LF: liver fibrosis; LT: liver transplantation; ROC: receiver operating characteristic curve.
Figure 1 — A model integrating donor gene polymorphisms predicts fibrosis after liver transplantation | Aging