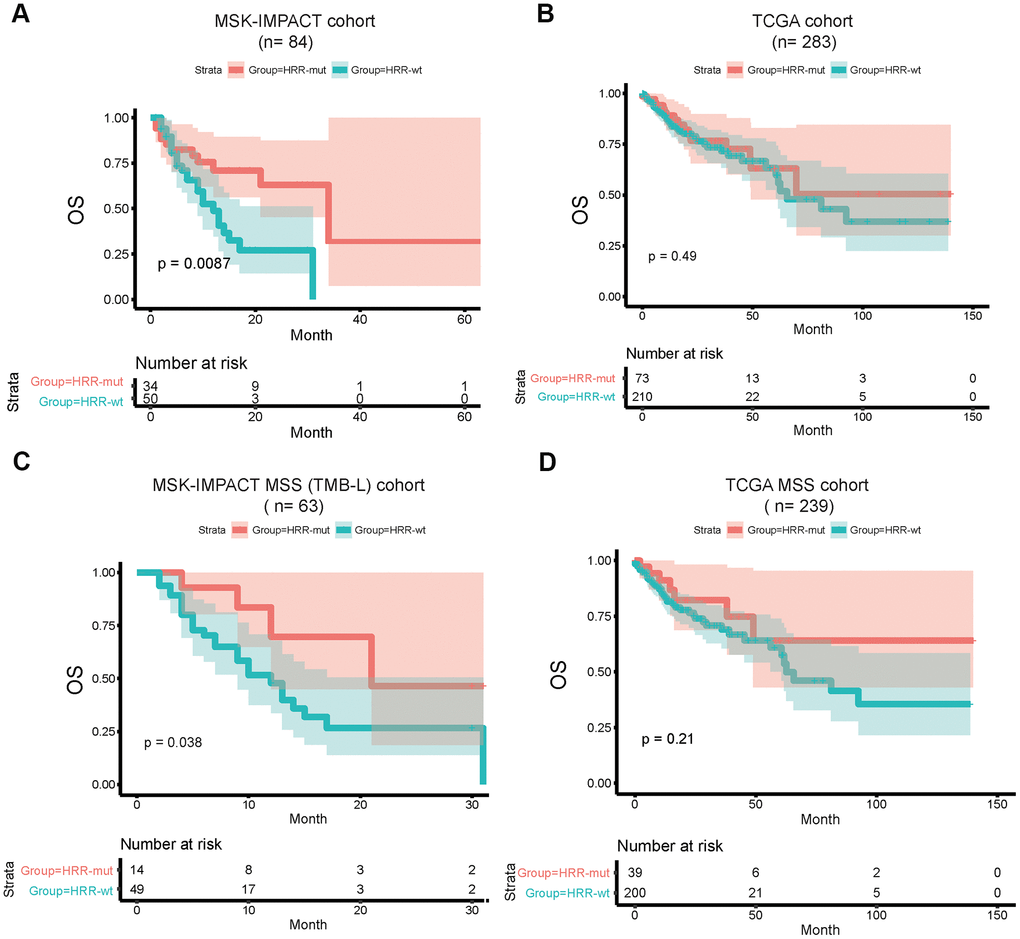
Figure 4.HRR-mut status is associated with a favorable therapeutic response to ICIs. Kaplan–Meier survival curves showing the OS times of patients stratified by HRR-mut/wt status in the MSK-IMPACT (A) and TCGA (B) cohorts. Kaplan–Meier survival curves showing the OS times of patients stratified by HRR-mut/wt status in the MSK-IMPACT MSS (TMB-L) (C) and TCGA MSS (D) cohorts. P values were calculated with the log-rank test.