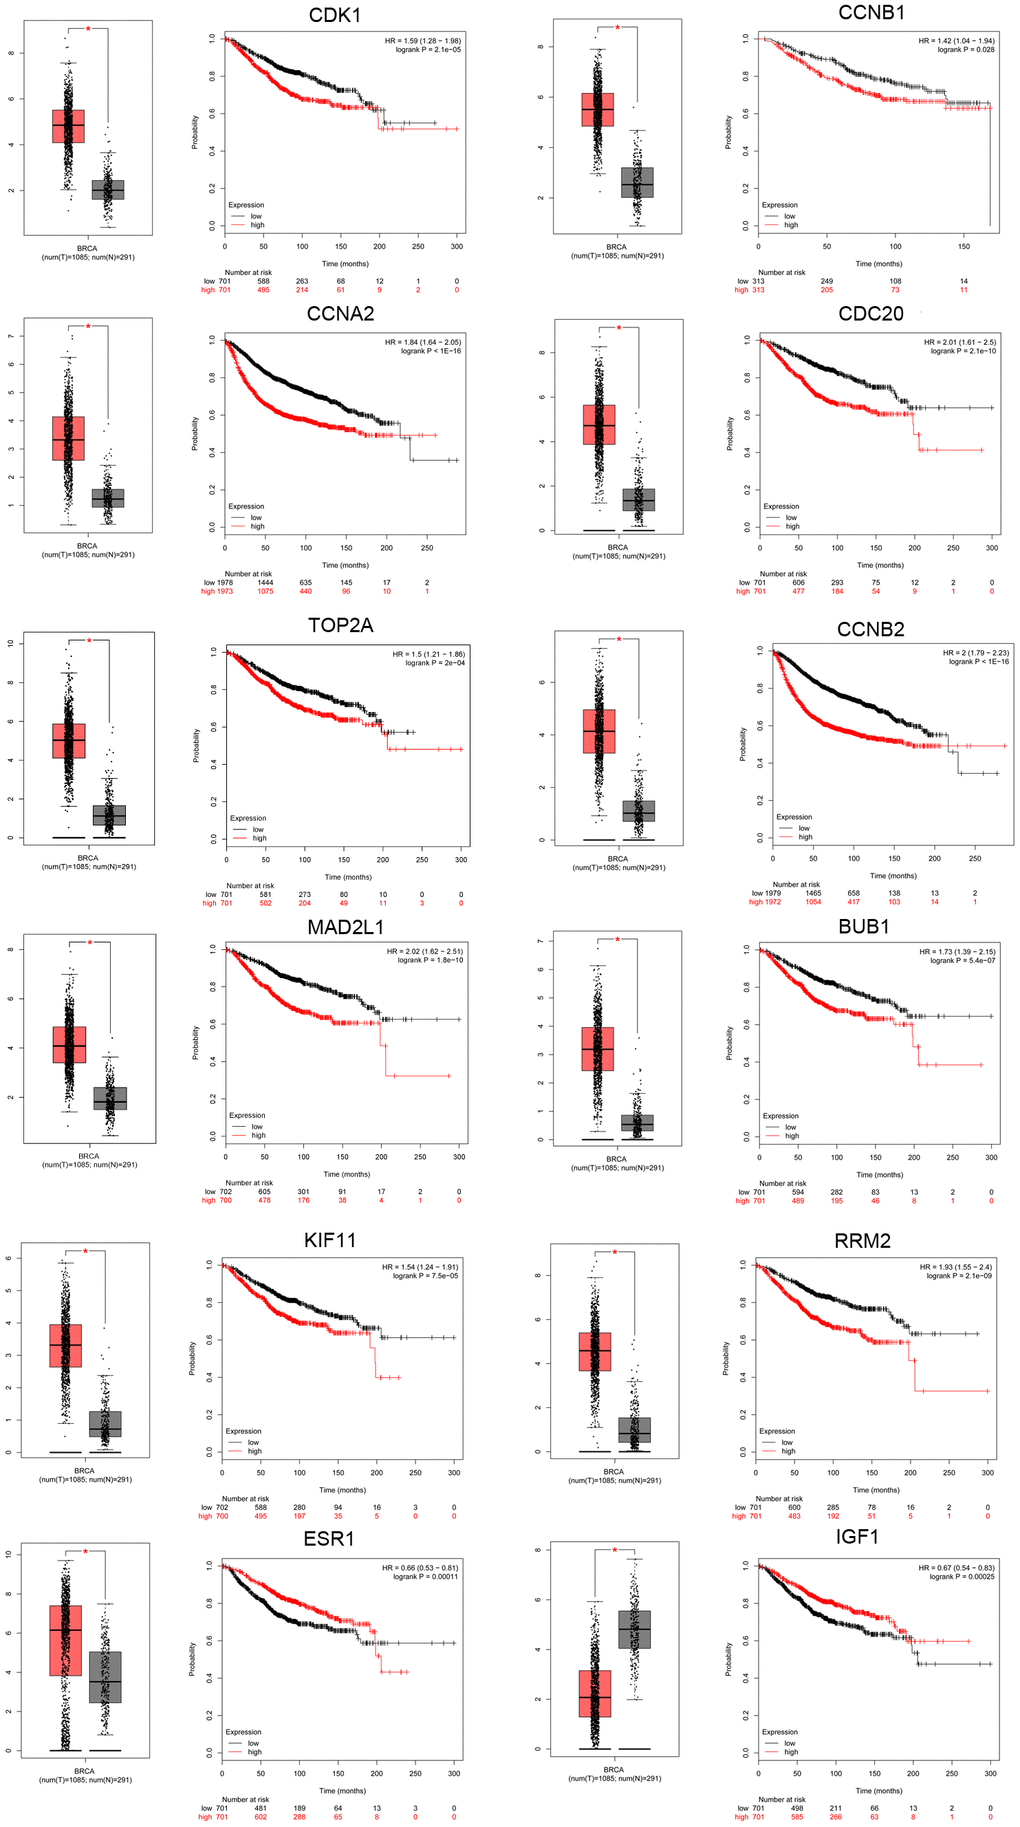
Figure 4.Screening of key genes in TNBC. Key genes were identified from the top 10 hub genes of the significant dysregulated DE-mRNAs by merging the prognosis and expression analyses using Kaplan Meier-plotter and GEPIA databases. Expression boxplots and survival curves (overall survival [OS]) of 12 key genes, including 10 upregulated hub genes (CDK1, CCNB1, CCNA2, CDC20, TOP2A, CCNB2, MAD2L1, BUB1, KIF11, and RRM2) and two downregulated hub genes (ESR1 and IGF1) in TNBC are presented.