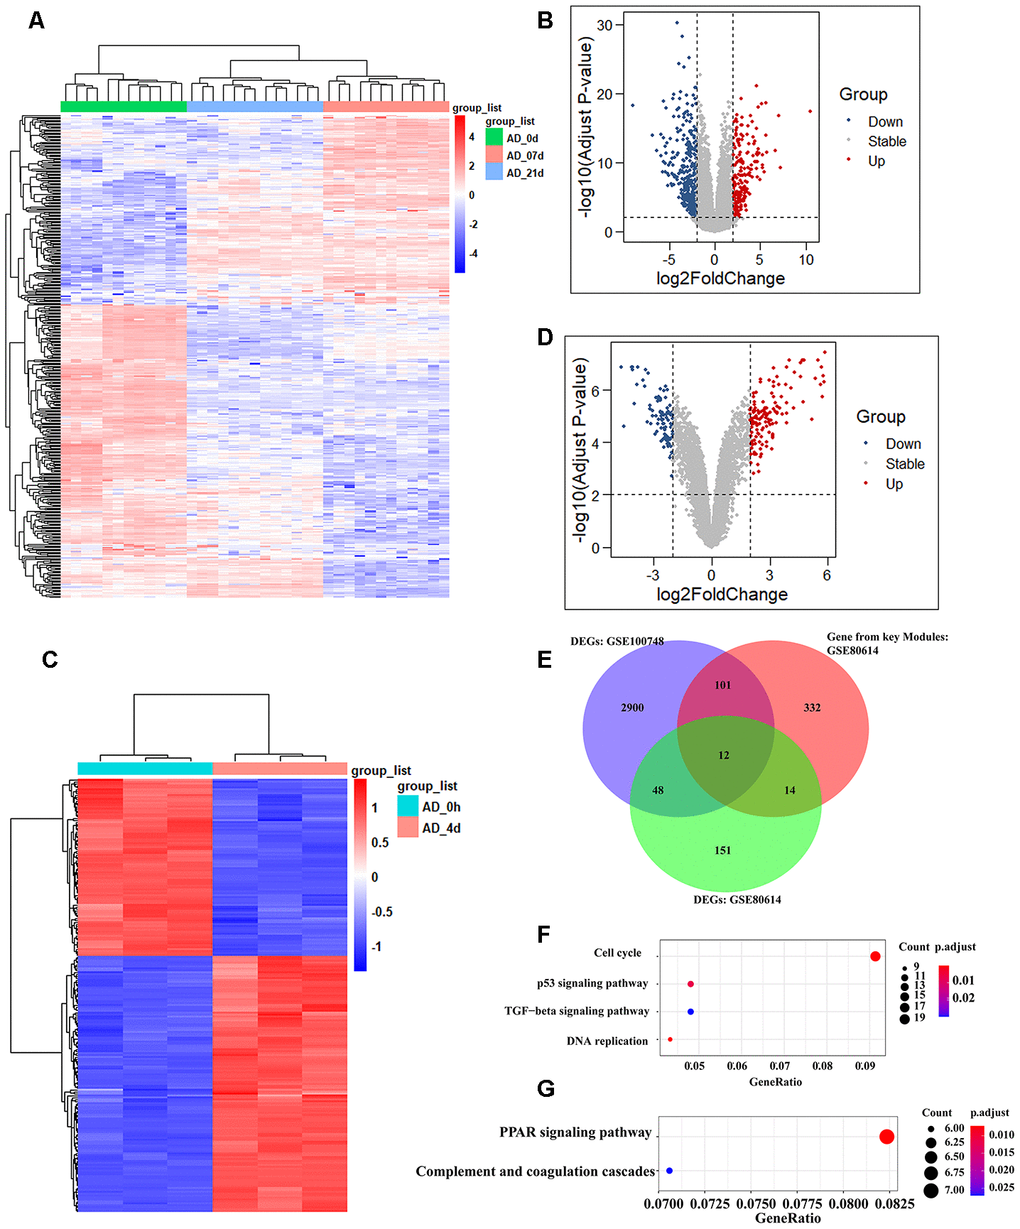
Figure 4.Identification of shared genes during adipogenesis in two datasets. (A, B) Heatmap (A) and volcano plot (B) of the DEGs from GSE100748 (Adjusted p-value ≤ 0.05 and |logFC| ≥ 2). (C, D) Heatmap (C) and volcano plot (D) of the DEGs from GSE80614 (Adjust p-value ≤ 0.05 and |logFC| ≥ 2). (E) Venn diagram for shared genes among DEGs and key modules of GSE100748 and DEGs of GSE80614. (F) KEGG analysis of DEGs from GSE100748. (G) KEGG analysis of DEGs from GSE80614.