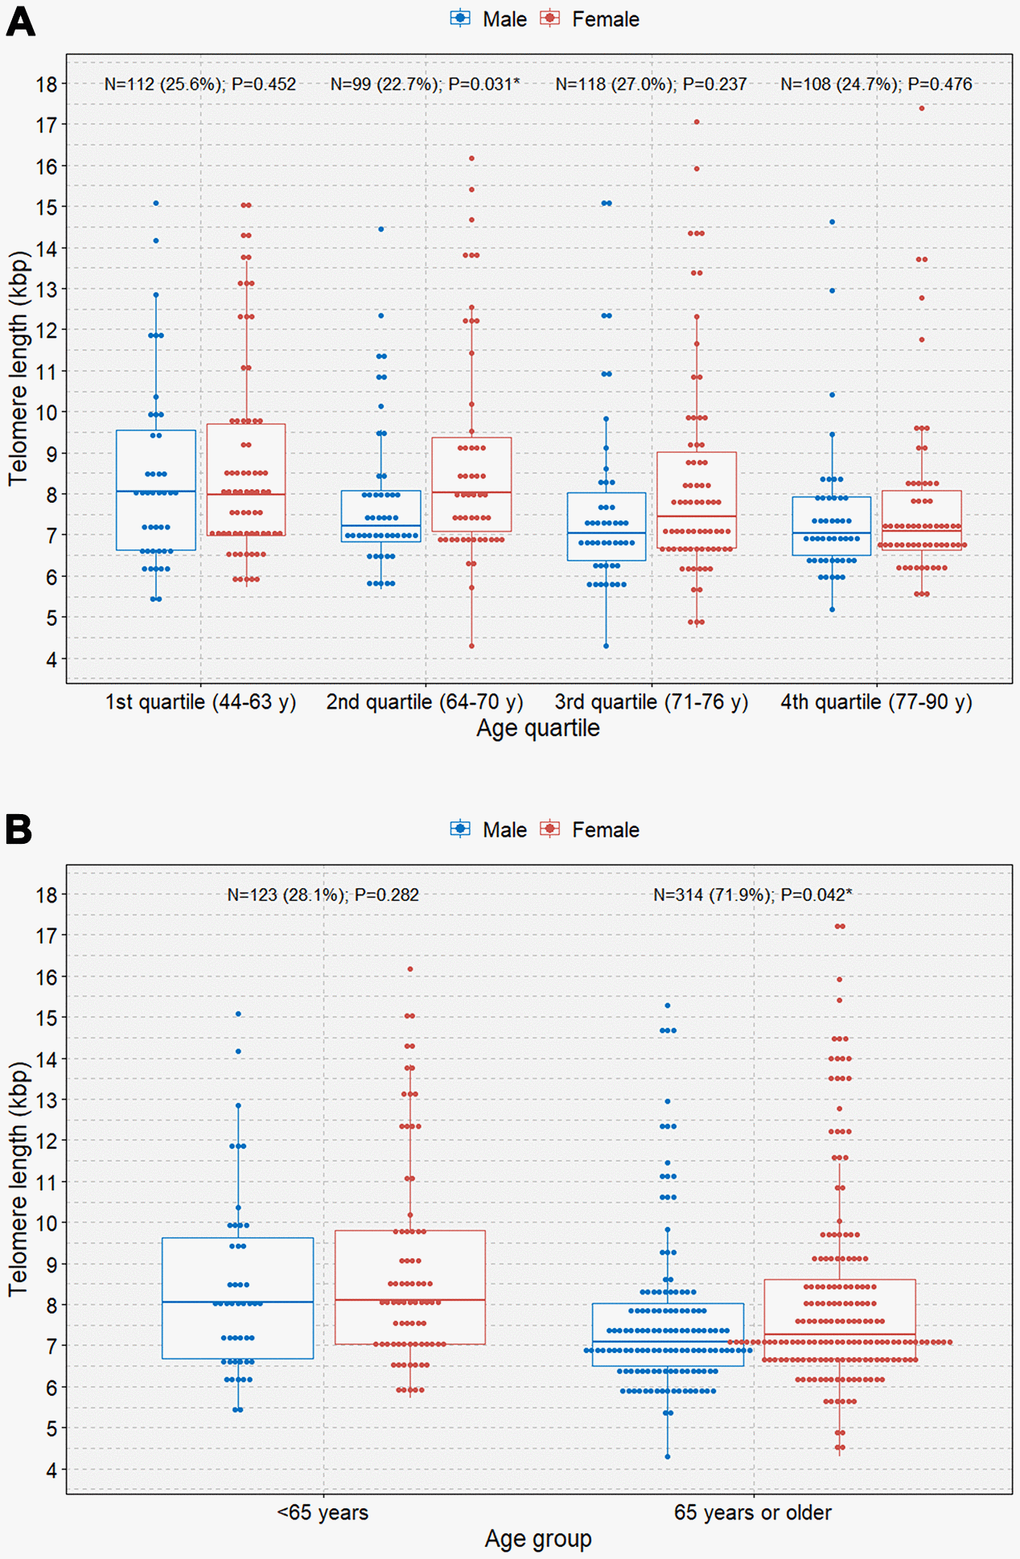
Figure 3.Boxplots with dot plots of telomere length. (A) telomere length classified by quartile age group according to sex; (B) telomere length classified by the 65-year age group according to sex. *P<0.05.
Figure 3 — Relationship between telomere shortening and age in Korean individuals with mild cognitive impairment and Alzheimer’s disease compared to that in healthy controls | Aging