Submit an Article
Navigate
Home
Editorial Board
Editorial Policies
Current Volume
Archive
Scientific Integrity
Publication Ethics Statements
Interviews with Outstanding Authors
Newsroom
Sponsored Conferences
Podcast
Contact
Special Collections
Submit an Article
Online ISSN: 1945-4589
Research Paper
|
Volume 13, Issue 1
|
pp. 794–812
Systematic construction and validation of an epithelial–mesenchymal transition risk model to predict prognosis of lung adenocarcinoma
Back to article
Figure 10
(10 of 10)
−
100%
+
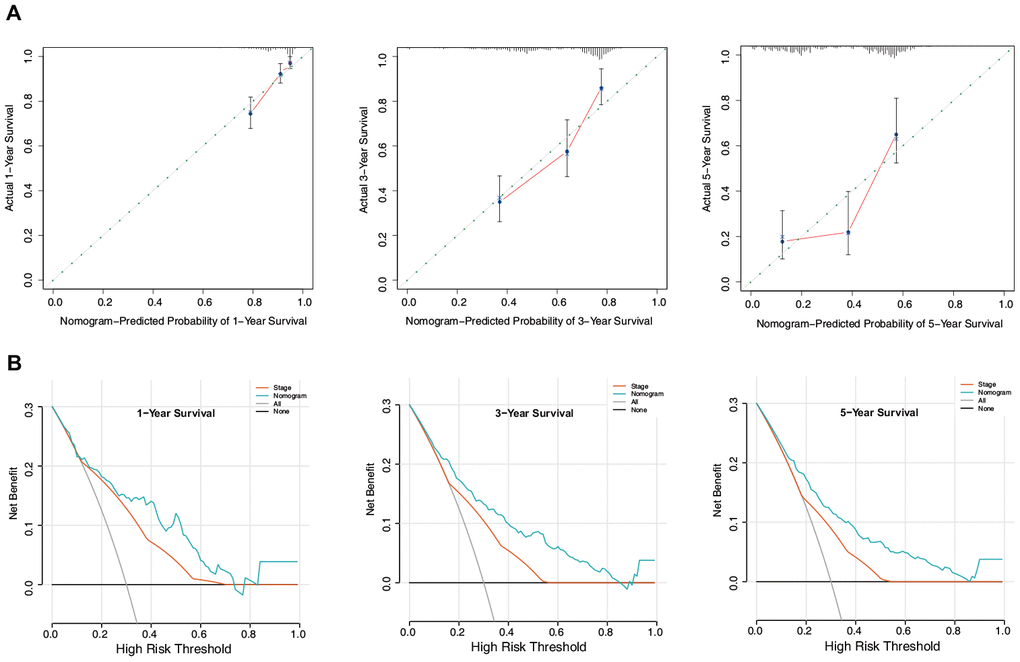
Figure 10.
Evaluation of the nomogram in the training set.
(
A
) Calibration plot of the nomogram for the prediction of OS. (
B
) DCA of the nomogram for the prediction of OS.