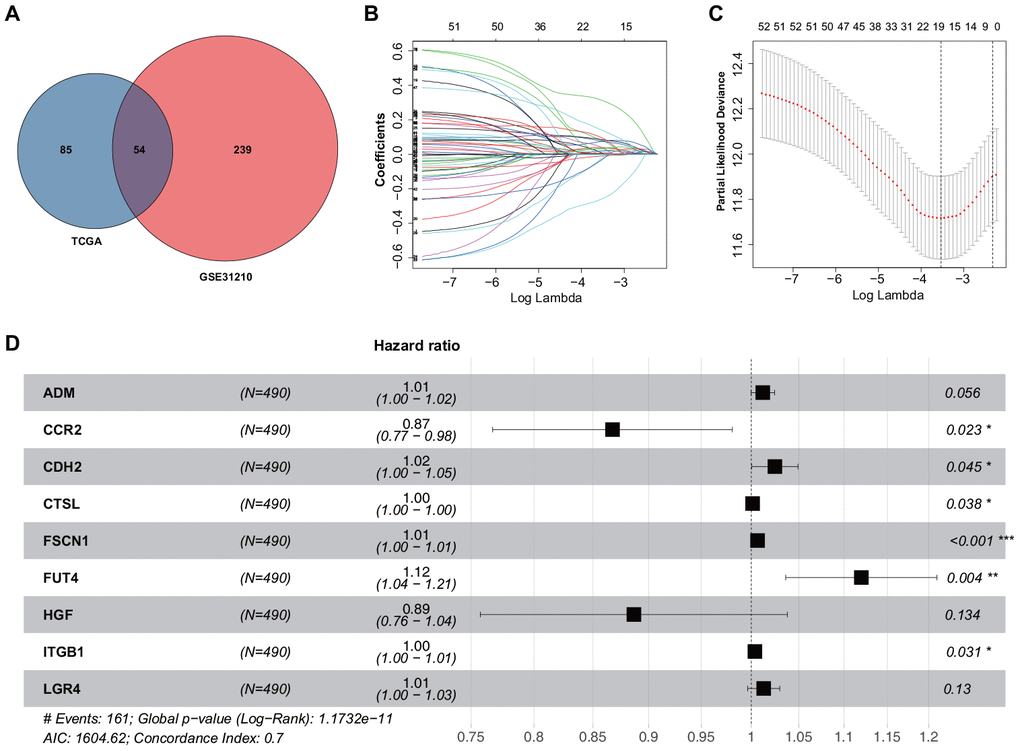
Figure 1.Construction of the ERG signature. (A) Identification of ERGs correlated with survival. (B) LASSO coefficients of the ERGs. Each curve represents an ERG. (C) Cross-validation of gene selection using 1-SE criteria in the LASSO regression analysis. (D) Forest plot of multivariate Cox regression analysis.