Submit an Article
Navigate
Home
Editorial Board
Editorial Policies
Current Volume
Archive
Scientific Integrity
Publication Ethics Statements
Interviews with Outstanding Authors
Newsroom
Sponsored Conferences
Podcast
Contact
Special Collections
Submit an Article
Online ISSN: 1945-4589
Research Paper
|
Volume 13, Issue 1
|
pp. 376–388
Genetic alterations in gastric cancer patients according to sex
Back to article
Figure 1
(1 of 2)
−
100%
+
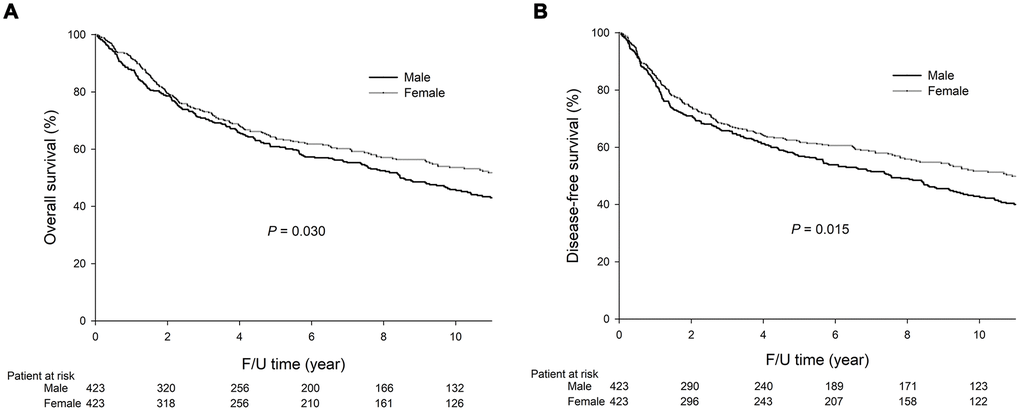
Figure 1.
The 5-year OS (60.9% vs. 64.0%,
P
=0.030) and DFS (56.9% vs. 62.0%,
P
=0.015) rates were significantly lower in the males than the females.
The survival curves are shown as follows: (
A
) OS curves of GC patients; (
B
) DFS curves of GC patients.